

MPAS Analysis
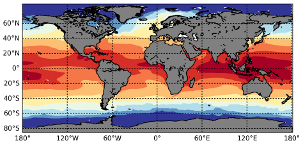
Sea Surface Temperature (SST) example plot
MPAS-Analysis software package provides at the in-depth analysis of earth system simulations made with the Model for Prediction Across Scales (MPAS) Ocean and Sea-Ice components in the E3SM.
MPAS-Analysis is almost entirely python based. It features a shared code structure, so that main tasks such as interpolation from unstructured to regular grid, computation of climatologies, compilation of time series, and plotting functions are part of shared routines used by different diagnostic tasks. Besides python, the package uses the NetCDF Operators (NCO) and Earth System Modeling Framework (ESMF) packages for interpolation, as well as NCO commands for compiling time series and computing climatologies. It also uses a simple Continuous Integration (CI) testing infrastructure to perform unit testing of shared routines. A large number of configuration options are available for user modification through a config file, which is passed to the main executable, called mpas_analysis.
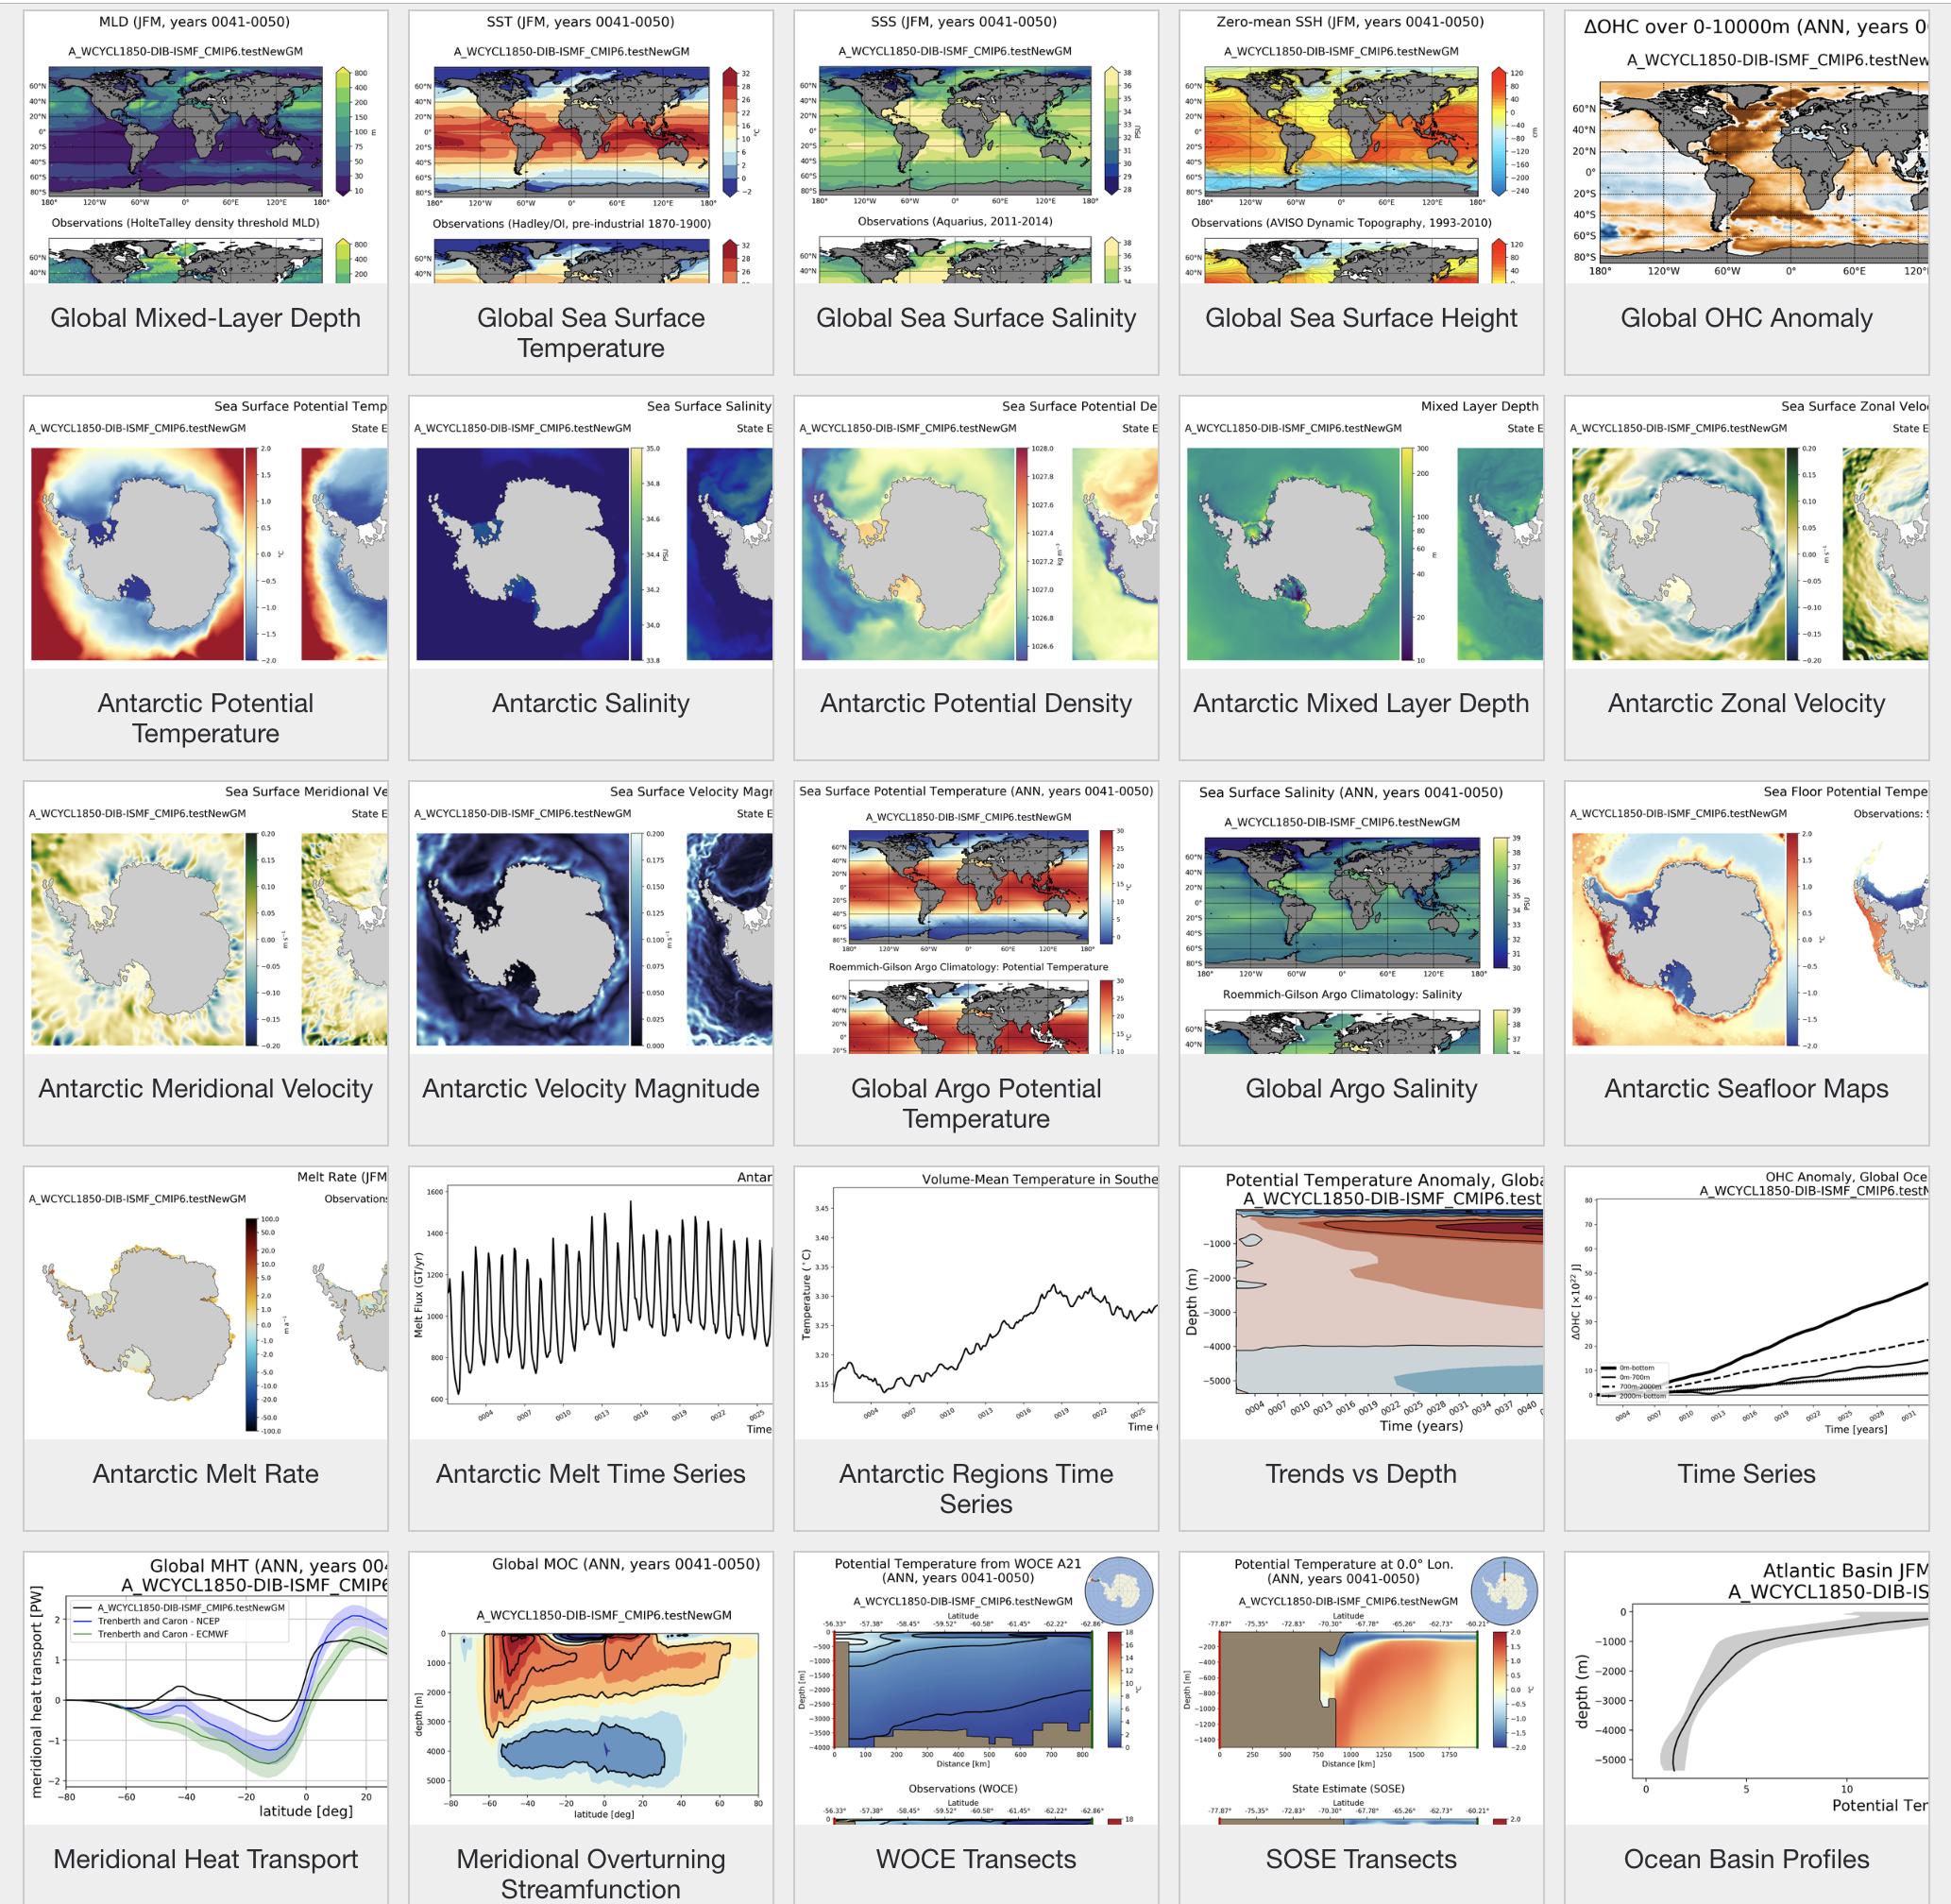
Mosaic images of MPAS-Analysis diagnostics presenting the types of diagnostic that are performed.
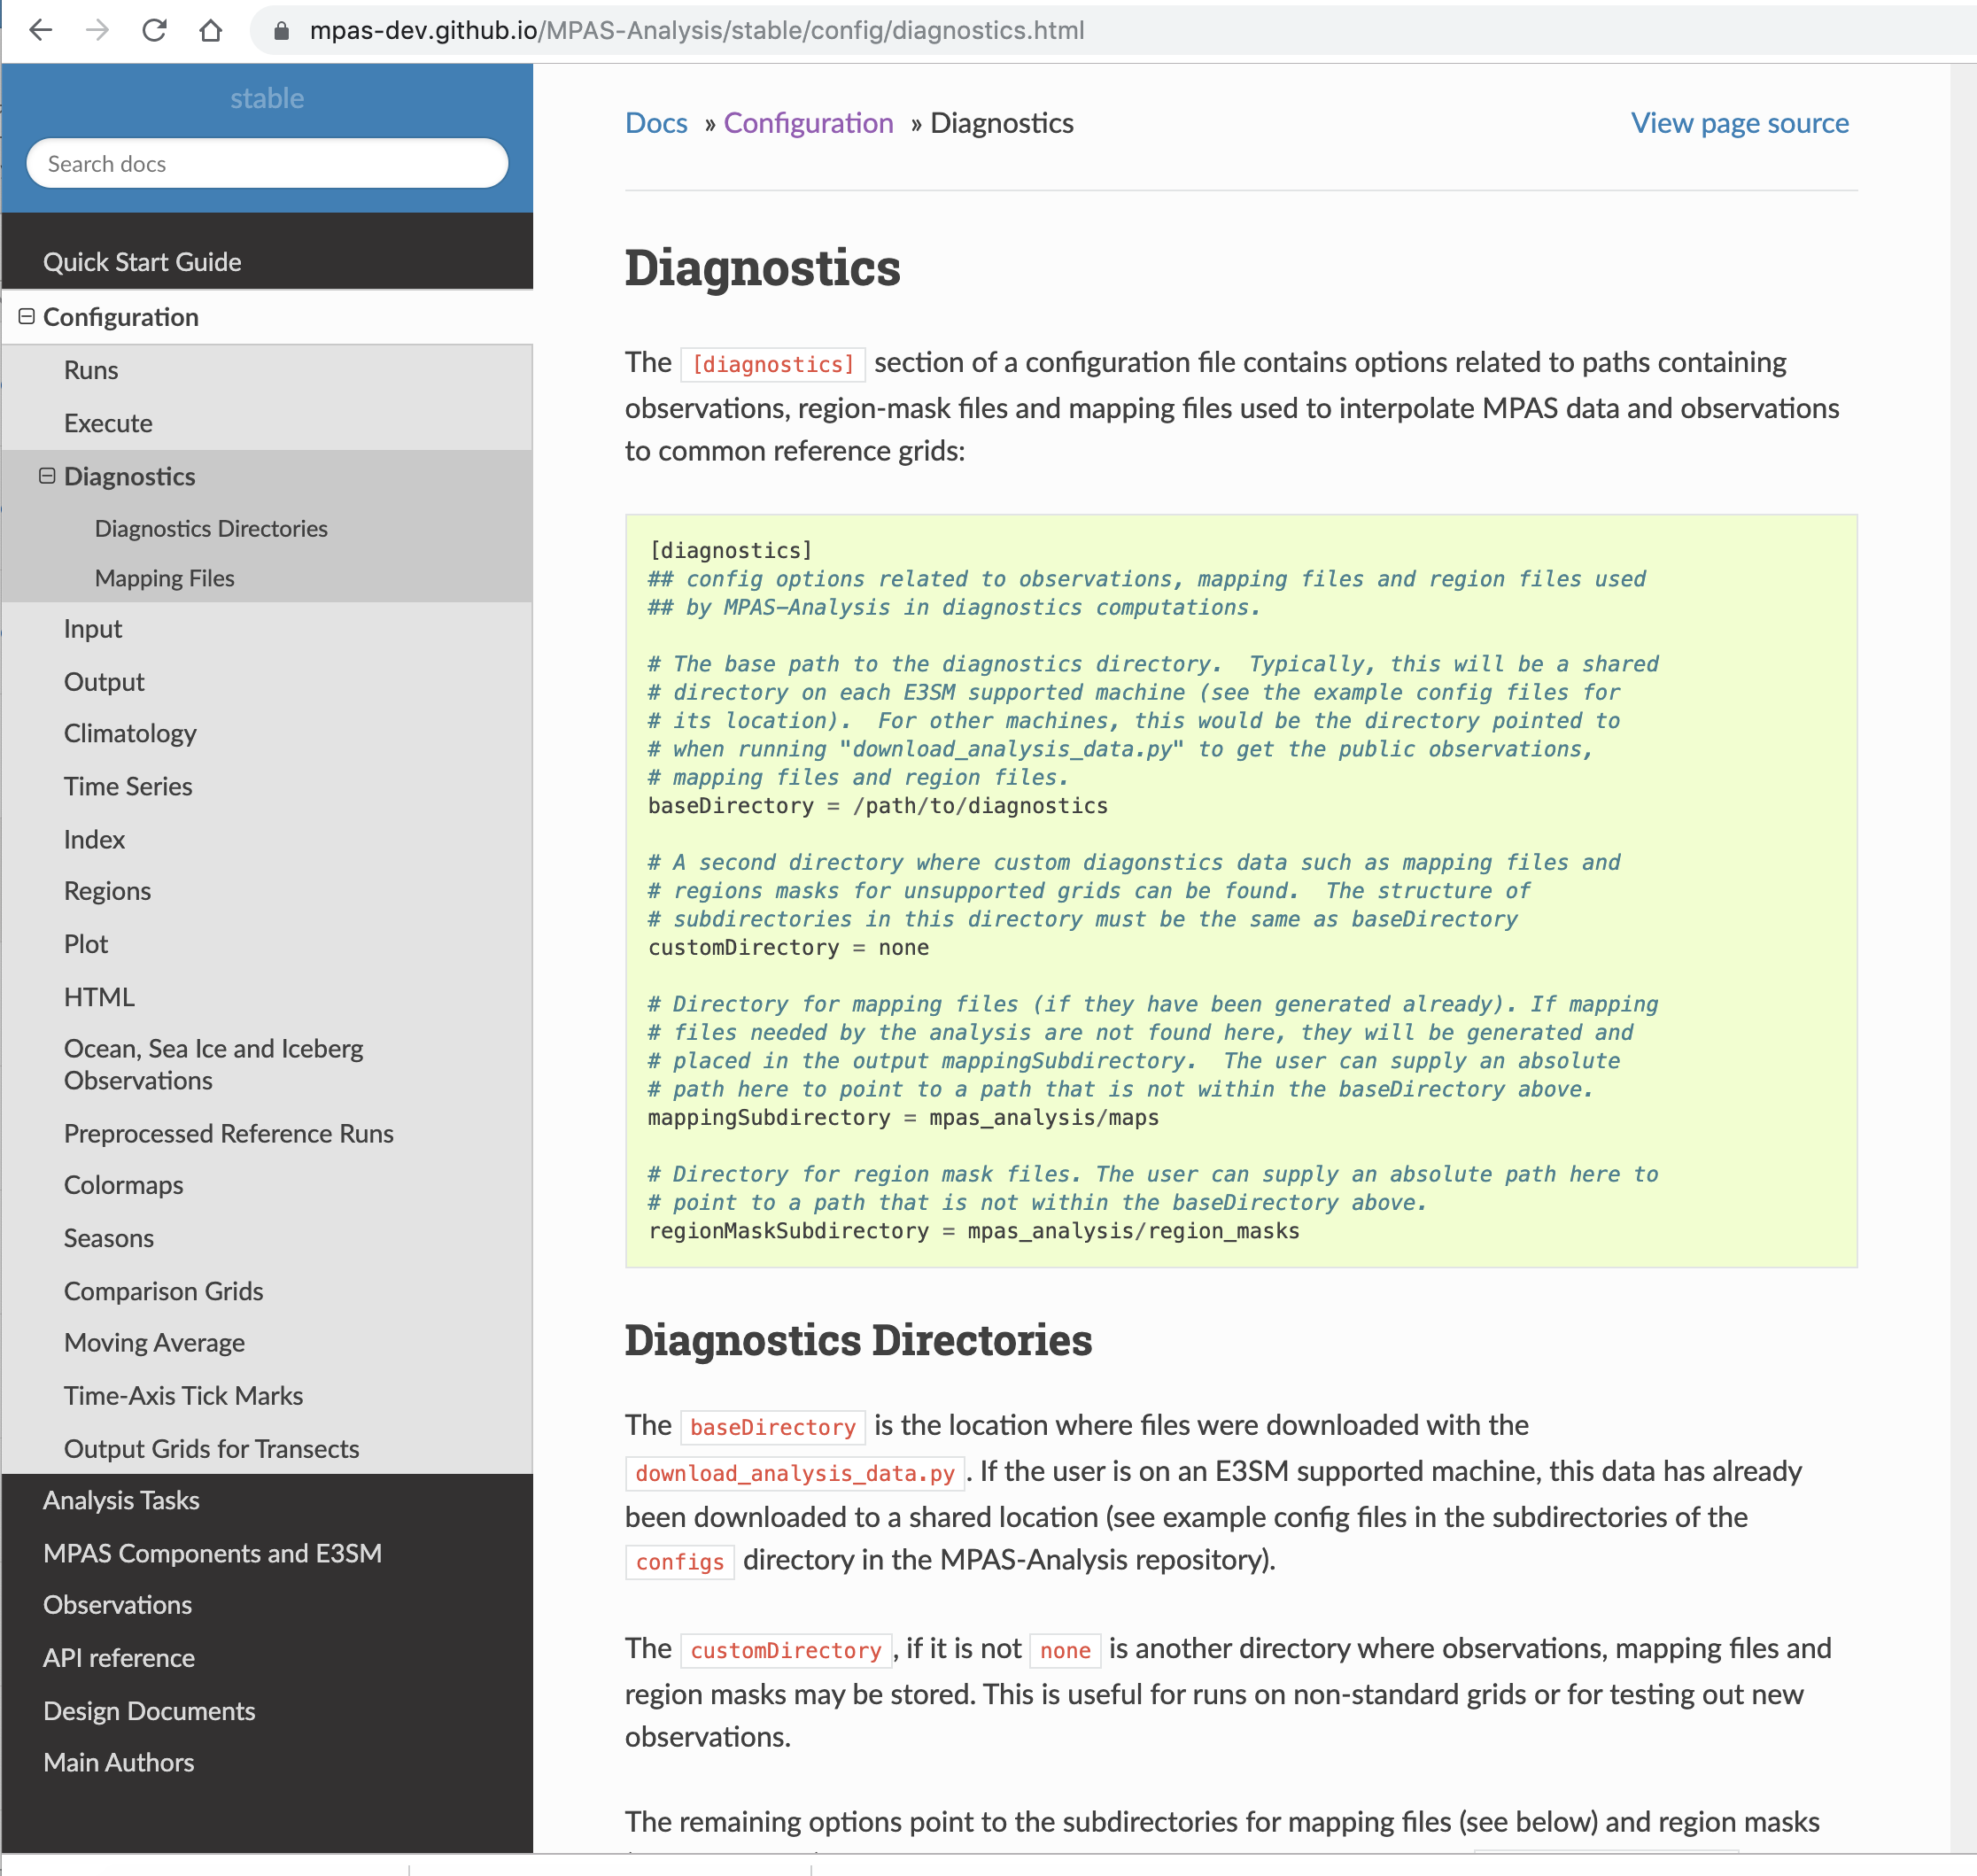
MPAS-Analysis Extensive Documentation
MPAS-Analysis supports 40 different analysis tasks, including:
- global maps of Sea Surface Temperature (SST), Sea Surface Salinity (SSS), Sea Surface Height (SSH), Mixed Layer Depth (MLD), T and S at various depths, and Ocean Heat Content (OHC) anomaly (all compared to various observational data sets);
- Southern Ocean maps of T, S, MLD, density and velocity (compared with the Southern Ocean State Estimate, SOSE, and World Ocean Atlas 2018, WOA18, data sets);
- trends of globally averaged SST, OHC for various depth levels, and Nino 3.4 index;
- trends vs depth plots of T and S with respect to the first year of the simulation;
- maps of sea-ice concentration and thickness for both hemispheres, compared with satellite observations;
- time series of sea-ice volume and aggregated area.
The resulting plots are viewable through a web interface, making it easy to share results with other groups or collaborators.
Documentation
- GitHub repo is at:
- Full Documentation is at:
- A quick start guide:
- Developer’s guide for updating MPAS-Analysis: (in progress)