

v1 Performance
Phase I Performance Improvement
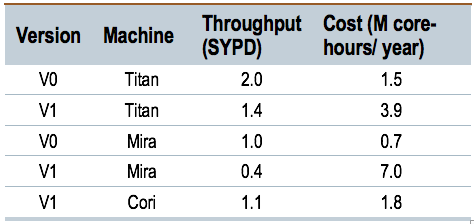
Optimal performance based on cost to allocation for each model version and computational platform. In spite of the increased number of calculations going from v0 to v1, the performance group was able to maintain constant throughput of roughly 1 SYPD.
During the first phase of the E3SM project, much of the focus needed to be on the creation and integration of a new model. The transition from version 0 (v0) to version 1 (v1) increased the computational cost by approximately a factor of 4 through a combination of increased vertical resolution, increased number of tracers, more expensive parameterizations (e.g. CLUBB) and the introduction of entire new ocean and ice components with more accurate (but more expensive) numerics. Despite the increased expense, work by the performance team limited the impact on throughput to only 30% as measured on Titan (see Table at right) and total cost to the allocation only increased by a factor of 2.3. Effectively, this meant a performance improvement of ~2x over this first phase of the project. Many improvements were obtained through the difficult process of profiling code, diagnosing bottlenecks and making moderate changes throughout. Larger speedups for specific sections of E3SM were achieved through algorithmic changes in the coupler (6x), algorithmic and communication changes in the ocean (1.5-2x), nested threading and vectorization in the atmosphere (1.25-1.5x) and tuning parallel I/O (6x). Table 1 shows final optimal throughput for high-resolution configurations of the v0 and v1 model on various machines, where “optimal” was determined by total cost to the allocation and not maximum throughput. The substantial increase in cost for Mira is largely due to the threading model and related memory increase in the new MPAS components that require scaling up on Mira’s memory-poor architecture.
Preparing E3SM for Next Gen Architecture and Beyond
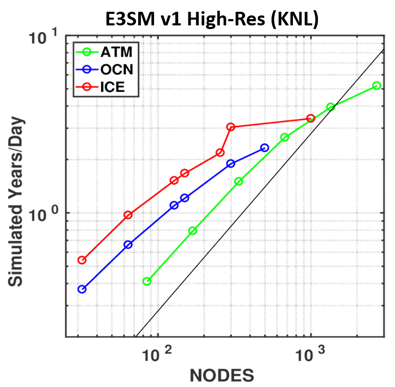
Throughput in SYPD for each component of the high-resolution v1 configuration on Cori’s KNL nodes. All components scale well; the ocean and ice scale better than their v0 counterparts.
A priority for the Performance Group is to prepare E3SM for next-generation (Next Gen) and future architectures. At the start of Phase I, the Next Gen architectures included the Intel many-core approach associated with the Cori machine at NERSC, as well as the GPU-enabled Summit machine installed at OLCF in 2018. We continue to pursue GPU optimization through this project and a companion Exascale Computing Program (ECP) project and we have had some early successes that will inform the work we will perform in Phase II. The Cori machine was installed just after our project started (late 2015). While there is ambiguity surrounding potential exascale architectures, Cori was at the time a candidate exascale architecture for which we chose to focus much of our advanced architecture effort and it will continue to be a primary platform for E3SM science results.
Our focus on Cori-KNL in Phase I resulted in a successful port of the model to this new architecture. Current performance and scaling for each of the components in the v1 high-resolution configuration is shown in figure above on the Cori-KNL system. All components run with 64 MPI tasks and two OpenMP threads per KNL node. These results show excellent scaling, using ~172k threads in atmosphere, and ~64k threads in ocean/ice. The MPAS ocean and ice components in v1 have dramatically improved scaling compared to the v0 POP/CICE models. The atmosphere component demonstrates improved per-node performance on Cori-KNL over Edison, though scaling per node is not as good on KNL due to the need to provide more computational work for the many cores on the node. Ocean and ice performance per node is currently equivalent on Cori and Edison, though we expect to achieve additional improvements on KNL as a result of ongoing work improving threading and vectorization.
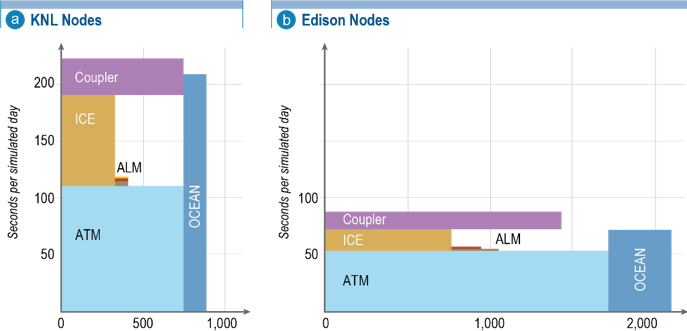
Processor layout and time spent in each component (ATM: atmosphere, ALM: land, ICE: sea ice, OCEAN: ocean) for optimal configurations on Cori-KNL and Edison. Components can be effectively load balanced, though the sea-ice interaction with the atmosphere creates a bottleneck and some idle processors in both configurations. This is being reduced as part of ongoing work.
To support the science campaigns, the Performance Group must tune the processor layout to achieve optimal throughput for the coupled system. Optimal configurations for the high-resolution configuration are shown in figure to the left for both KNL and Edison. On Cori-KNL, this 825-node configuration achieves 1.1 SYPD and costs 1.2 million (M) core-hours per simulated year (1.8M with NERSC charging factor included). The figures show the time spent in each component against the processor allocation for each component. Toward the end of Phase I, we introduced some communication improvements and new decomposition schemes to reduce this bottleneck associated with the sea-ice component’s tight coupling with the atmosphere; these are not reflected in the figures.
Performance Infrastructure
Performance optimization requires a performance infrastructure that we have developed and continue to maintain. This infrastructure includes standard timing and profiling tools, as well as a performance capture and archiving capability. All simulations using the E3SM model automatically capture detailed performance information that is collected and archived in a specific location on each of our production platforms. This database has proved very useful in diagnosing performance bottlenecks as well as machine anomalies. The Performance Group is also tasked with analyzing and creating optimal processor layouts (PE layouts) for production simulations. We have created a database of more than 70 of these optimal layouts, including entries for each production machine, each standard coupled model configuration, some other common single-component and partially coupled options, and a few (small, medium, large) PE layouts. All E3SM team members can view and use the layouts to obtain optimal throughput for their simulations.