

v2 LR Description
The E3SMv2 lower resolution model is the physical coupled model consisting of atmosphere, land, river transport, ocean, and sea-ice components. E3SMv2 represents a significant evolution from E3SMv1 with substantial updates to its numerical core and improvements in the simulated climate.
The lower resolution configuration of E3SMv2 includes a grid spacing of 110 km in the atmosphere, 165 km in the land, 0.5° in the river routing model, and a grid spacing that varies between 60 km in the mid-latitudes and 30 km at the equator and poles in the ocean and sea ice components.
E3SMv2 is approximately twice as fast (or efficient if measured in terms of power) compared to E3SMv1. The efficiency gains are achieved in the atmosphere and ocean components. In the atmosphere, they arise from a new semi-Lagrangian tracer transport method and a new grid for physics calculations. The gain in the ocean is due to a longer allowable timestep.
The atmospheric physics, while based on the same set of parameterizations as v1, underwent significant retuning in v2 to improve clouds and precipitation (Figure 1).
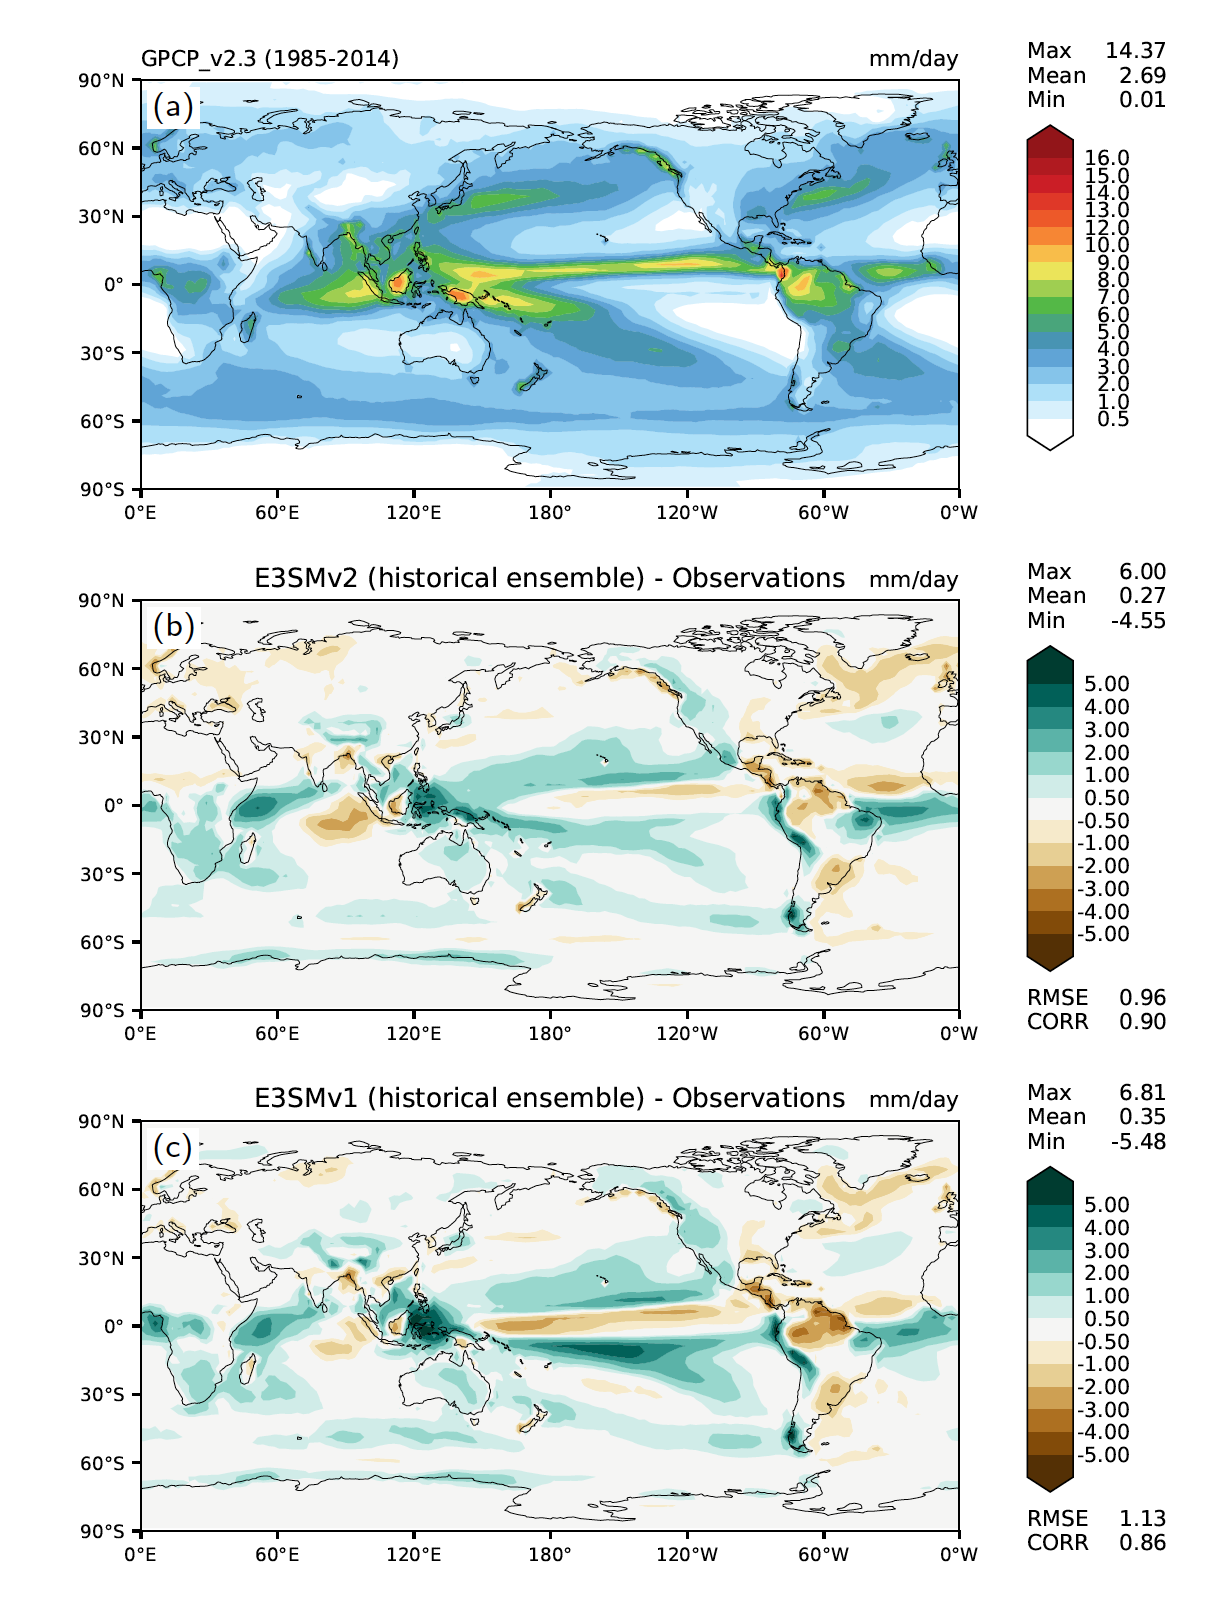
Figure 1: Annual precipitation rate (mm/day): (a) Global Precipitation Climatology Project v2.3 observational estimate (1985-2014), (b) model bias from the 5-member ensemble of E3SMv2 historical coupled simulations (1985-2014), and (c) model bias from the 5-member ensemble of E3SMv1 historical coupled simulations (1985-2014).
Additionally, a new convective trigger function for the deep convection (Xie et al., 2019) significantly improves the phase of the diurnal cycle of precipitation, but the amplitude remains weaker than observed (Fig. 2).
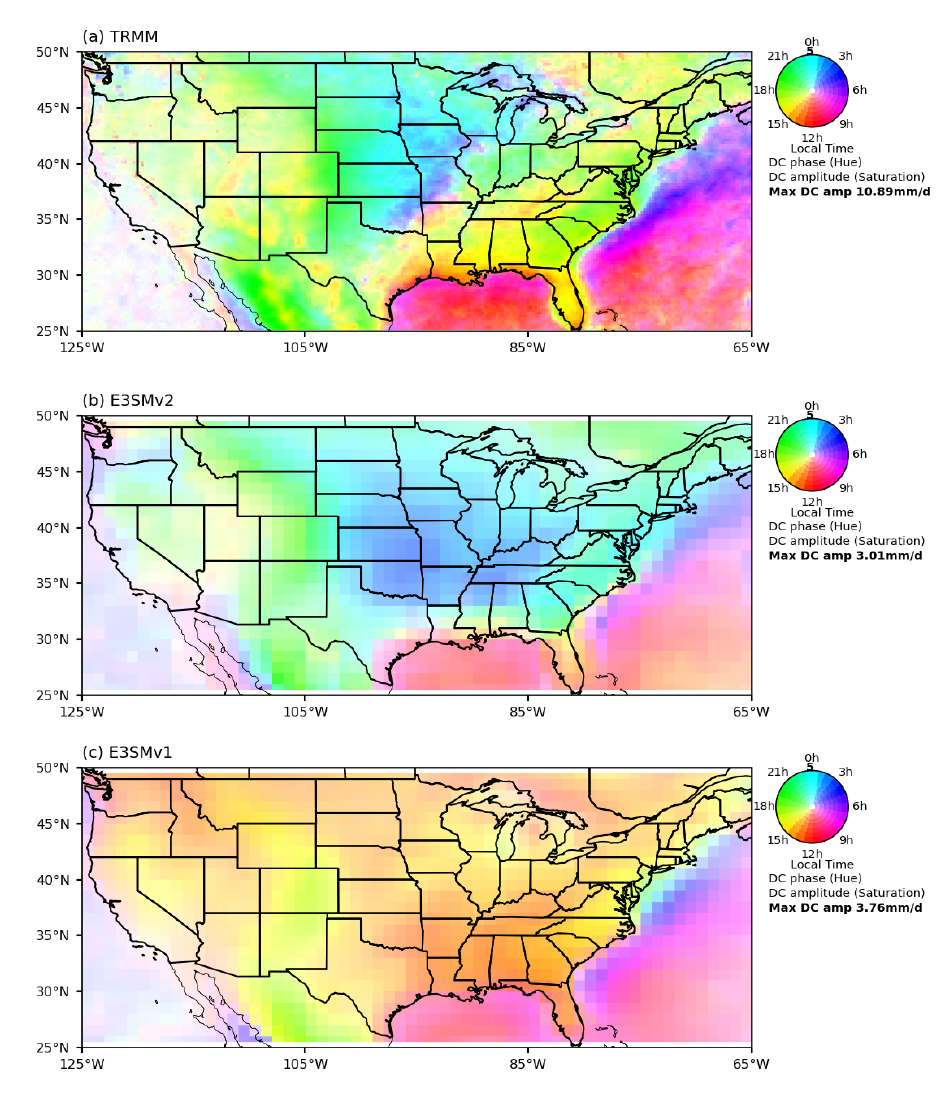
Figure 2: June-July-August mean time phase (color) and amplitude (color density) of the first diurnal harmonic of 3-hourly total precipitation (mm/day) from (a) TRMM (1998-2013), and historical simulations (1985-2014) of (b) E3SMv2 and (c) E3SMv1.
The equilibrium climate sensitivity (ECS) is a common metric to quantify the warming of a model in response to an increase in greenhouse gases. ECS is defined as the equilibrium surface temperature change resulting from a doubling in CO2 concentrations. Because it is not practical to run a model to equilibrium (it would take thousands of years), ECS is approximated by linear regression of top-of-atmosphere radiation vs. surface temperature in a 150 year simulation where CO2 is abruptly quadrupled. In E3SMv2, ECS is significantly reduced compared to v1 (4.0 K vs 5.3 K) which is mostly attributable to a smaller cloud feedback. An ECS value of 4.0 K is much more plausible than 5.3 K according to a recent assessment (Sherwood et al., 2020). The transient climate response (TCR) measures a model’s response to CO2 on shorter time scales. TCR is defined as the change in surface temperature averaged for a 20 year period around the time of CO2 doubling from a simulation in which CO2 concentration is increased by 1% every year. In E3SMv2, TCR is more realistic with a magnitude of 2.4 K compared to 2.9 K in v1. The effective aerosol forcing which measures the radiative impact of aerosol and their interaction with clouds remains essentially unchanged in v2 (ERF aer = −1.5 W m−2 ). While relatively large, this value is within the likely range assessed by Bellouin et al. (2020).
Unfortunately, the combination of a weaker climate sensitivity without significant reduction in aerosol forcing leads to a worse representation of the global mean surface temperature during the second half of the 20th century (Figure 3). An analysis of single-forcing simulations indicates that correcting the historical record in E3SMv2 would require a substantial reduction in the magnitude of aerosol forcing (∼75%), and a moderate reduction in the TCR (∼25%) (gold line in Figure 3).
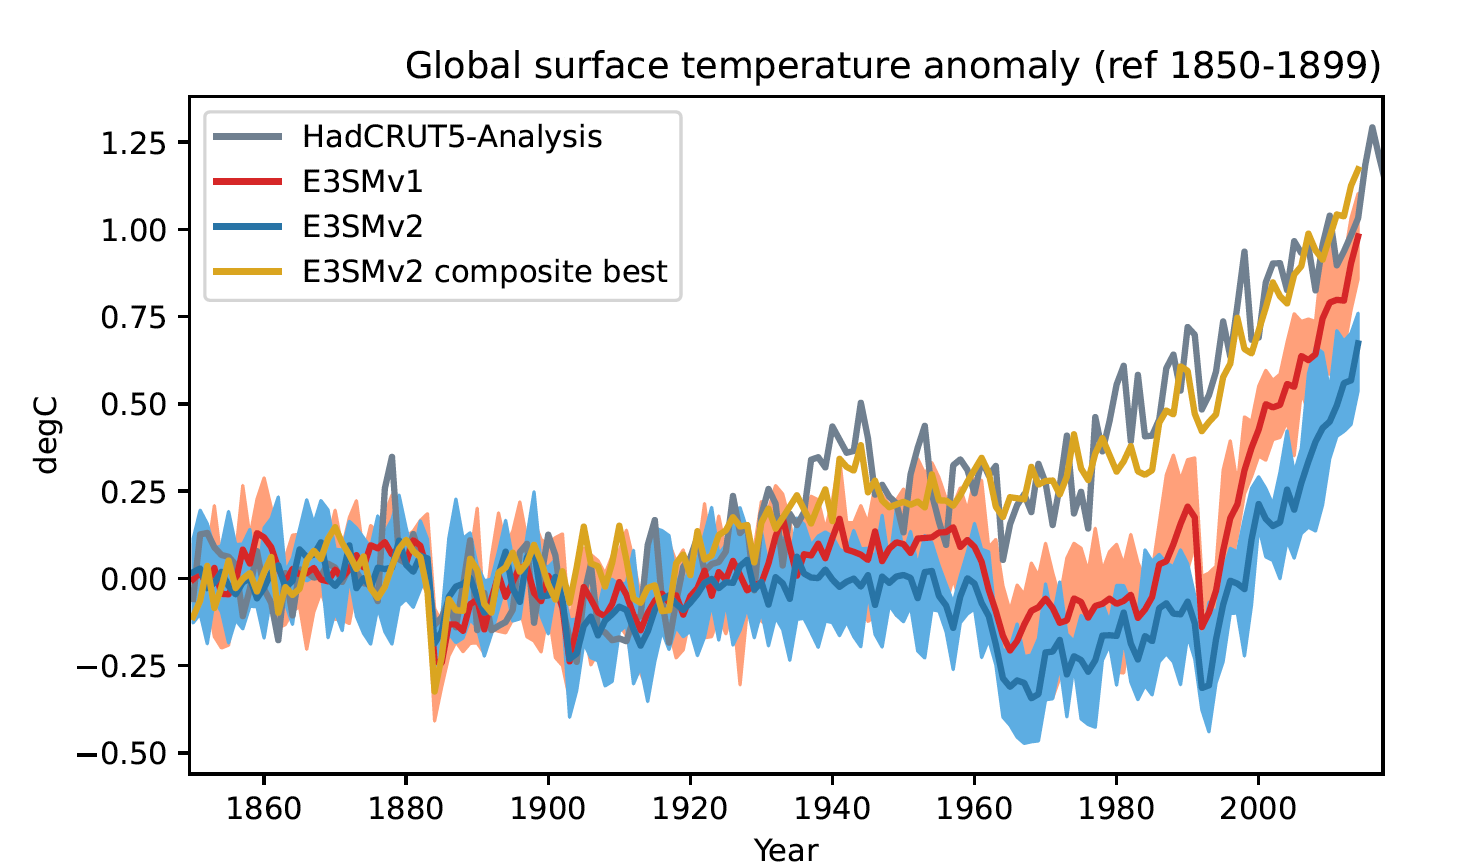
Figure 3: Time evolution of annual global mean surface temperature anomalies (with respect to 1850-1899). Comparison between observations from HadCRUT5-Analysis (grey), E3SMv1 ensemble mean (red) and range (orange) and E3SMv2 ensemble mean (dark blue) and range (light blue). Also shown (gold) is a best estimate obtained by scaling E3SMv2 greenhouse-gases and aerosol single forcing simulations.
Addressing the poor simulation of the temperature record is a high priority for future versions of E3SM, along with remediating the weak Atlantic Meridional Overturning Circulation (AMOC) in v2 and v1. Since finalizing v2, substantial progress has already been made on AMOC. E3SM has just finalized an intermediate version v2.1 with a revised ocean that significantly increases the strength of AMOC as well as reduces regional SST and sea-ice biases compared to v2. Results from E3SMv2.1 will be the subject of an upcoming manuscript.
Data availability
All model codes may be accessed on the GitHub repository. A maintenance branch (maint-2.0) has been specifically created to reproduce these simulations. Bit-for-bit results with the original simulations on identical machines will be maintained on that branch for as long as the computing environment supports it. Complete native model output is accessible directly on NERSC (https://portal.nersc.gov/archive/home/projects/e3sm/www/WaterCycle/E3SMv2/LR) with accompanying documentation at https://e3sm-project.github.io/e3sm_data_docs. A subset of the native output is also available through the DOE Earth System Grid Federation (ESGF; https://esgf-node.llnl.gov/search/e3sm/?model_version=2_0 ). Data reformatted following CMIP conventions will also be available through ESGF at https://esgf-node.llnl.gov/search/cmip6/?source_id=E3SM-2-0.
Reference
Golaz, J.-C., Van Roekel, L. P., Zheng, X., Roberts, A. F., Wolfe, J. D., Lin, W., et al. (2022). The DOE E3SM Model version 2: Overview of the physical model and initial model evaluation. Journal of Advances in Modeling Earth Systems, 14, e2022MS003156, https://doi.org/10.1029/2022MS003156
Related Articles
- E3SM v2.0 code GitHub – E3SM-Project/E3SM at Maint-2.0
- E3SM v2.0 model output
- on NERSC (Listing of /home/projects/e3sm/www/WaterCycle/E3SMv2/LR/
- on ESGF in E3SM project space (in native format) https://esgf-node.llnl.gov/search/e3sm/?model_version=2_0
- on ESGF in CMIP6 project space (in CMIP6 format) https://esgf-node.llnl.gov/search/cmip6/?source_id=E3SM-2-0
- E3SMv2 Performance Highlighted at AGU Session, Feb 2022
- HOMME Non-Hydrostatic Dycore at 3 km Resolution Achieves 0.97 SYPD on Summit, Nov, 2020
- New Physgrid and Dycore Methods Speed Up EAM by 2x, May 2020
- Conservative Multimoment Tracer Transport, Feb 2020
- E3SM v1.0 Overview Paper on Coupled Model