

Overview Paper on Coupled Model
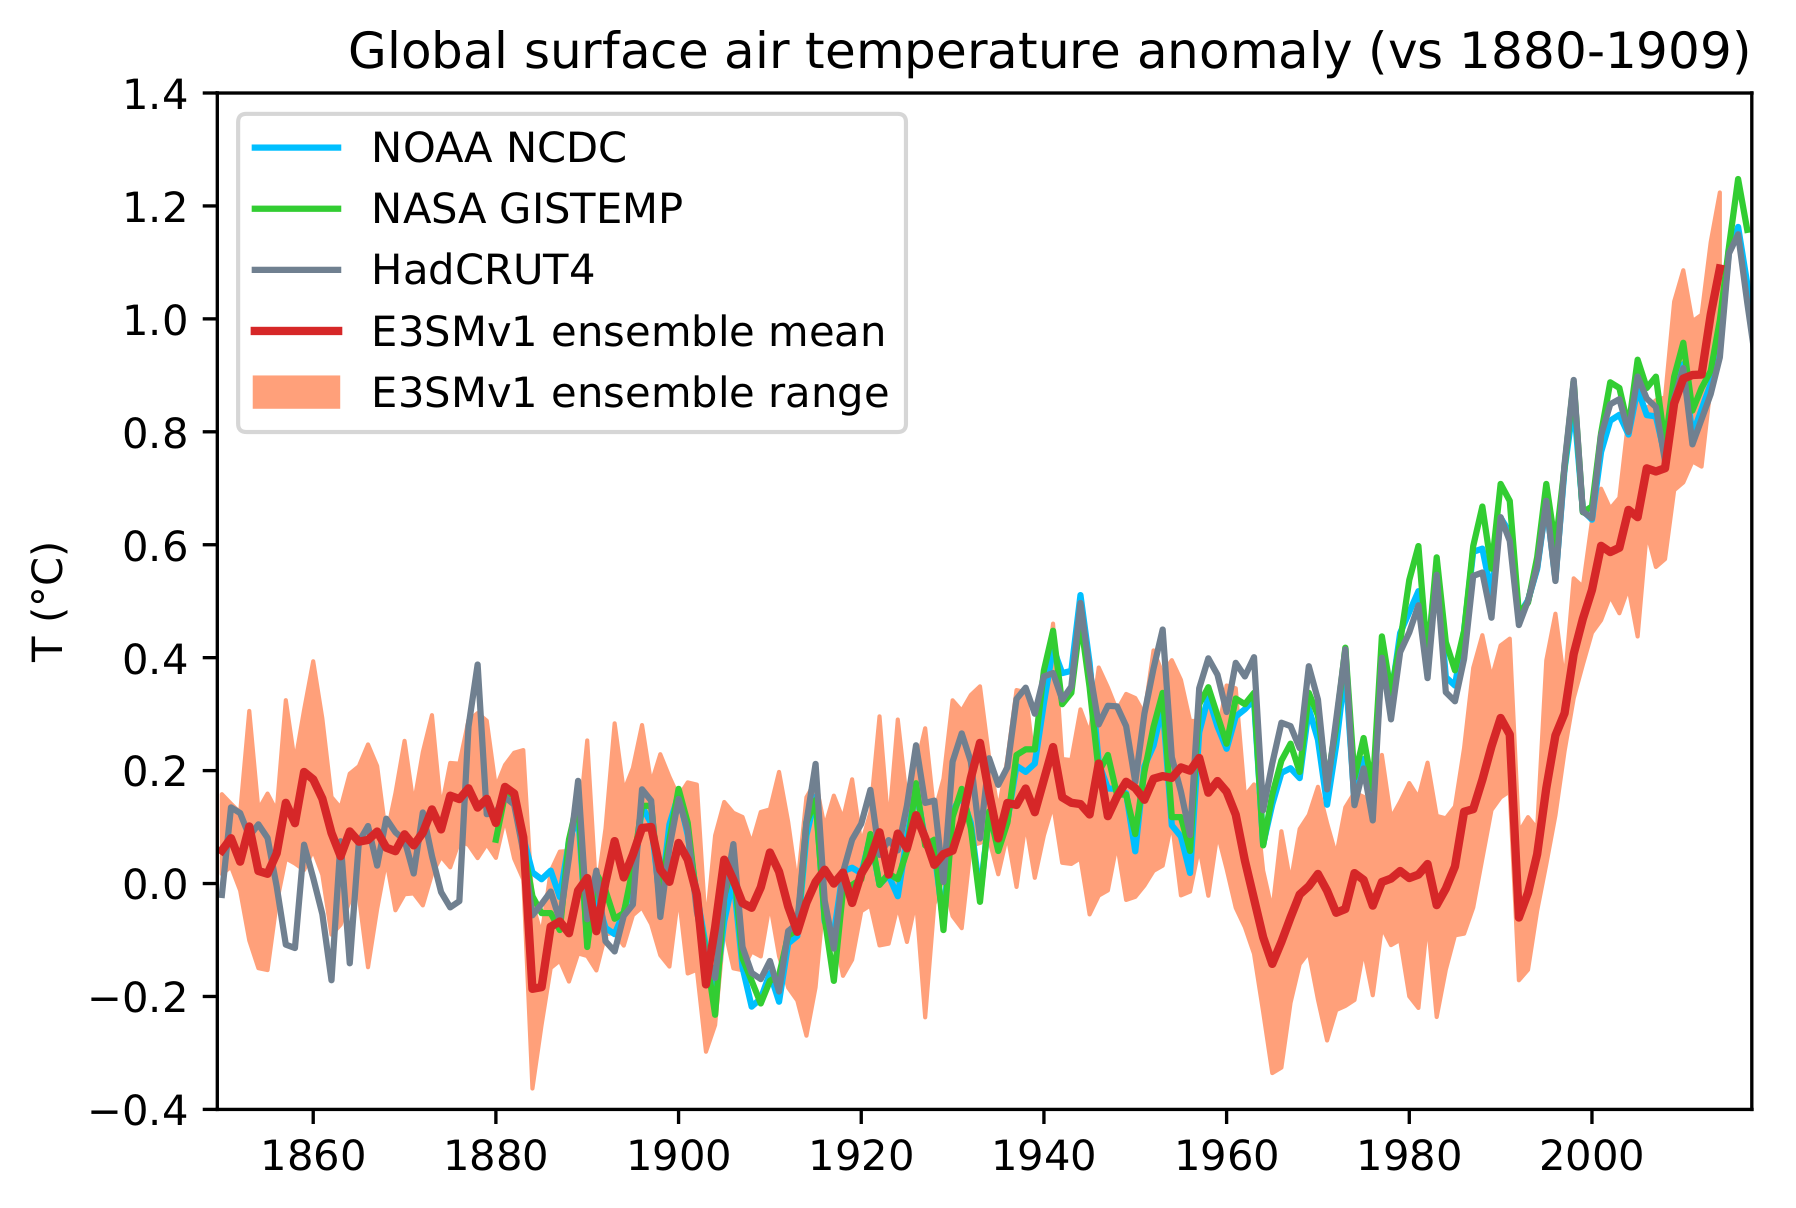
Time evolution of annual global mean surface air temperature anomalies (with respect to 1880-1909). Comparison between observations from NOAA NCDC (blue), NASA GISTEMP (green), HadCRUT4 (grey) and E3SMv1 ensemble mean and range (red and orange).
The DOE E3SM coupled model version 1: Overview and evaluation at standard resolution.
In March 2019, a paper that documents and evaluates the performance of the E3SM Version 1 model at its standard resolution was accepted for publication in Journal of Advances in Modeling Earth Systems (DOI: 10.1029/2018MS001603).
This paper will serve as the main reference for the E3SM v1 model.
Background
In 2013, the US Department of Energy (DOE) developed a report summarizing observed long-term trends that, if continued for several decades, would have major impacts on the energy sector [U.S. Department of Energy, 2013]. Among these were regional trends in air and water temperatures, water availability, storms and heavy precipitation, coastal flooding and sea-level change.
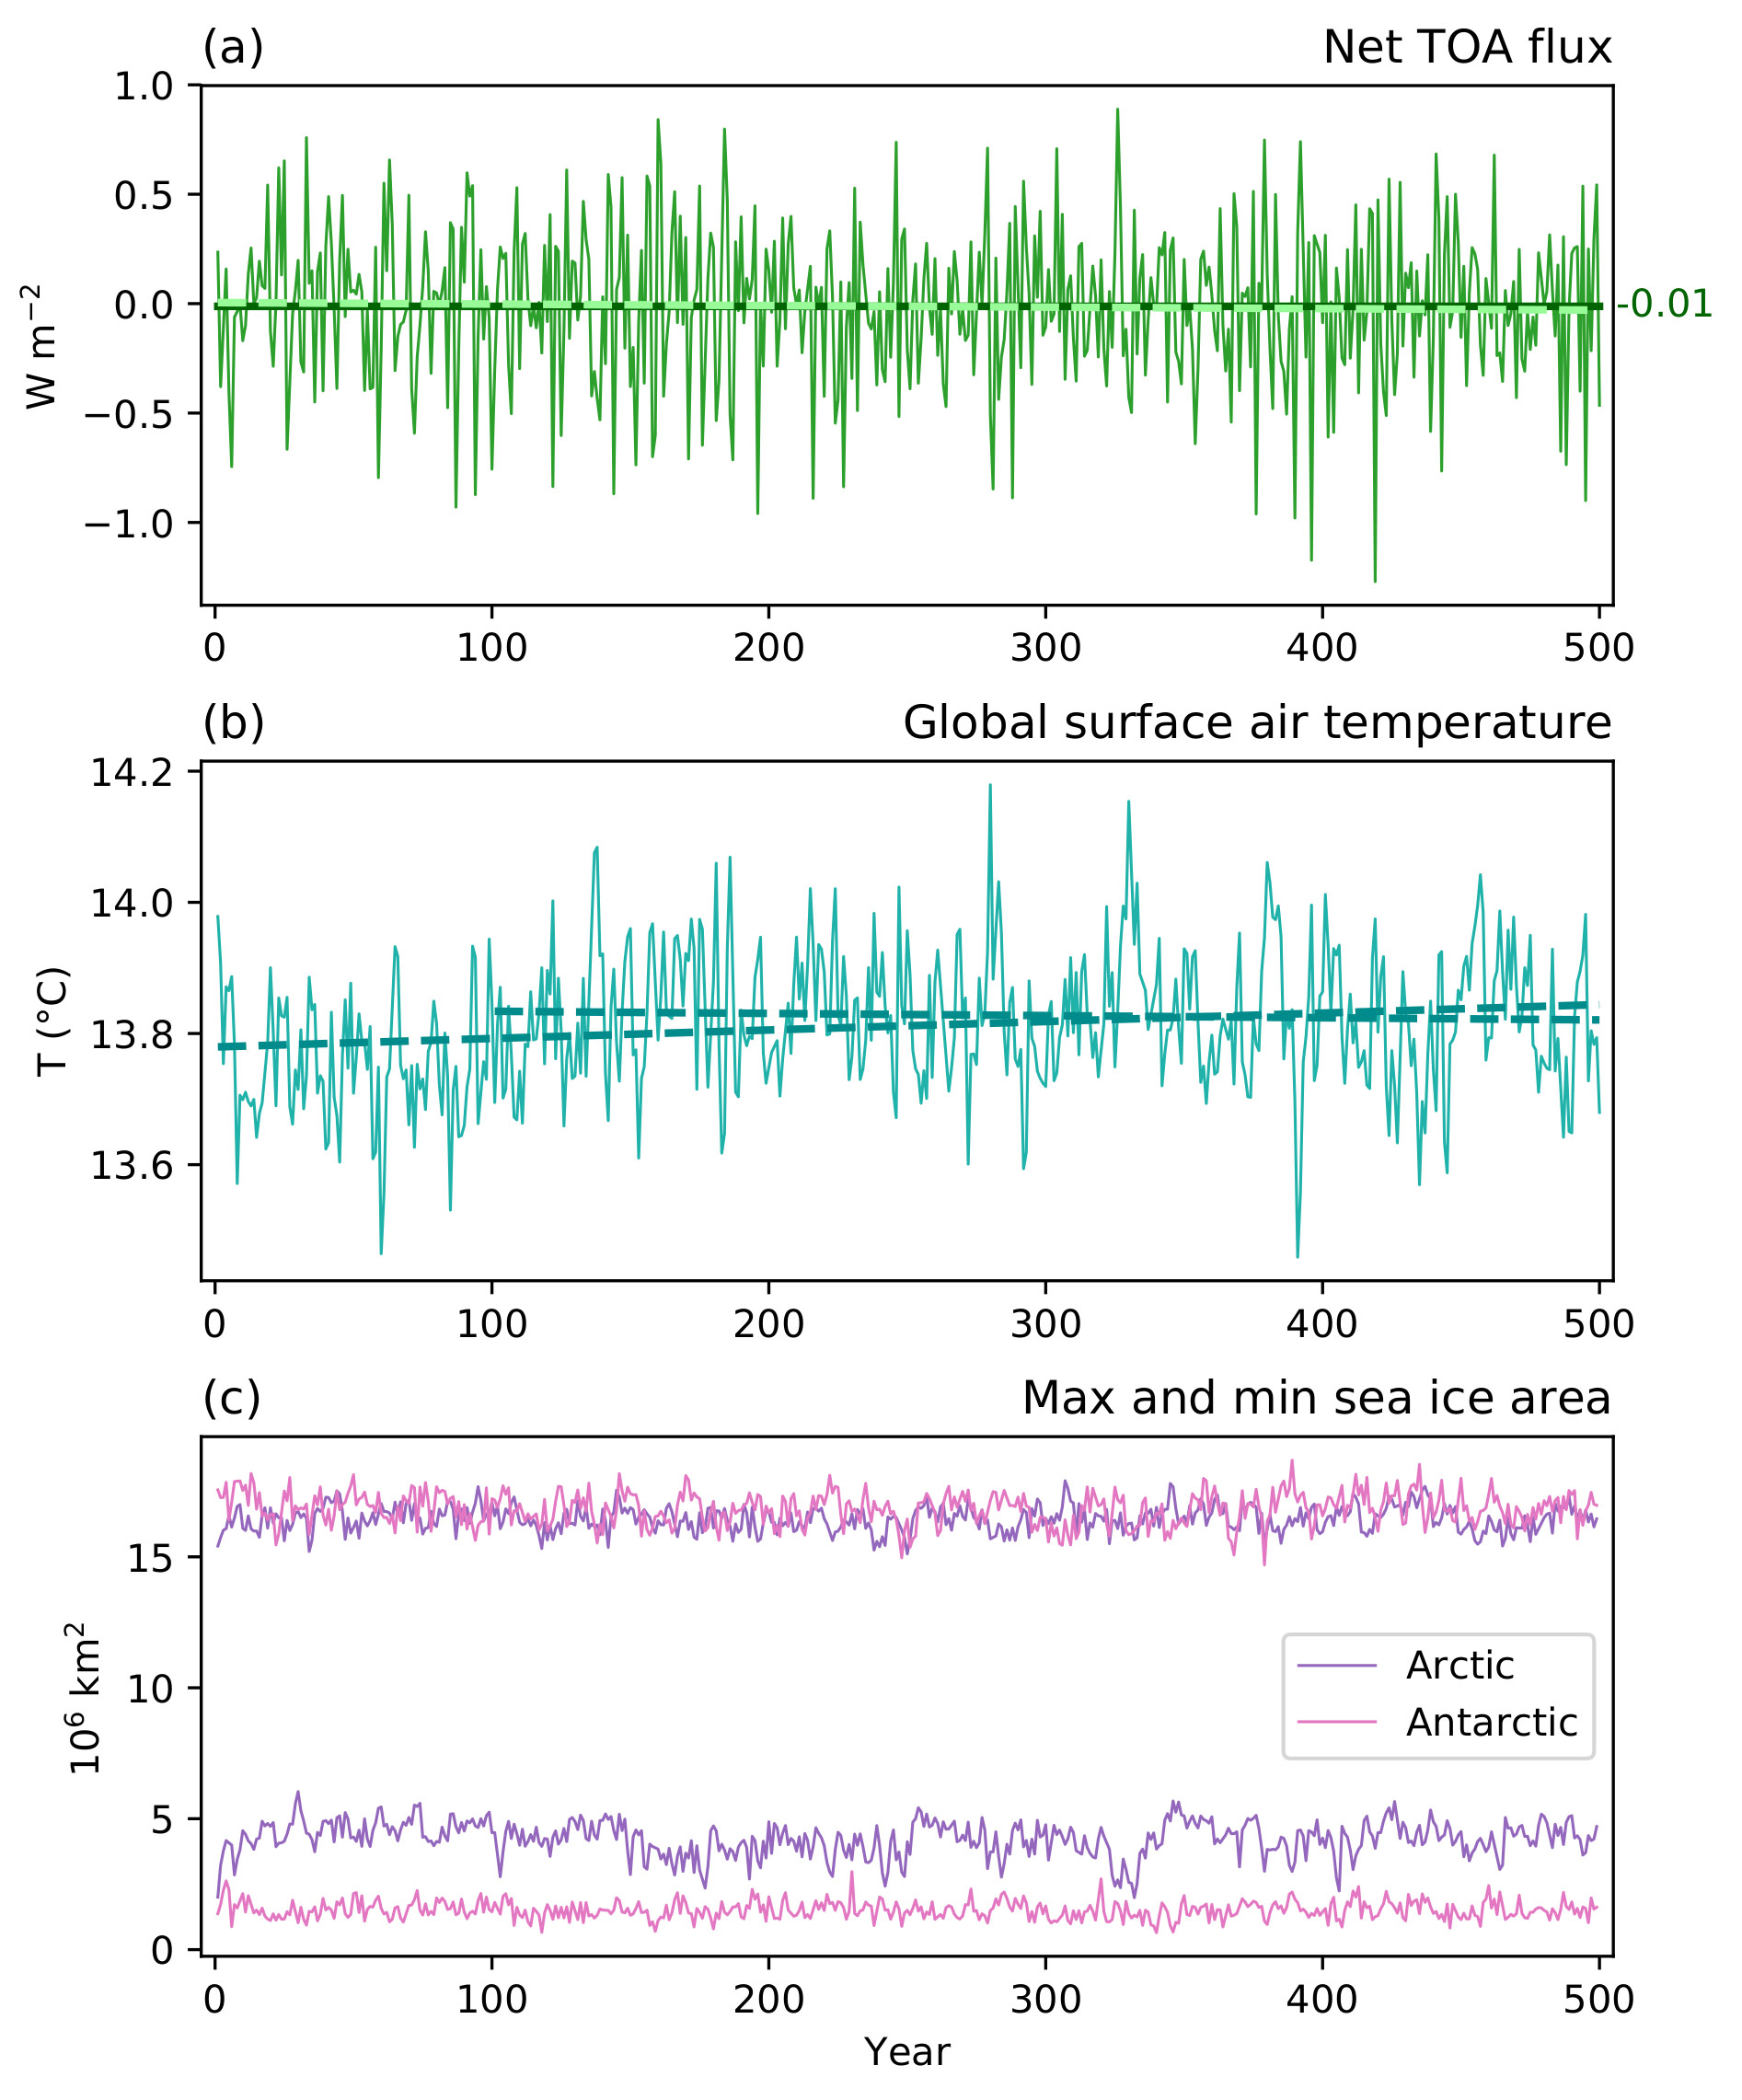
Time evolution of annual (a) global mean net TOA radiation (positive down), (b) global mean surface air temperature, and (c) maximum and minimum of total sea ice area for the Arctic and Antarctic in the piControl simulation. Dashed lines in (a) and (b) represent linear trends. The solid straight line in (a) is the mean TOA energy imbalance of -0.011 W m^2.
The ability to simulate and predict significant, long-term changes in these environmental variables important to energy-sector decisions required capabilities beyond the existing state-of-the-science Earth system models. The Energy Exascale Earth System Model (E3SM) project was conceived to meet this mission need [Bader et al., 2014].
With the release of E3SMv1 model and the initial set of simulations described in this study, DOE now has the capabilities needed to examine long-term changes in environmental variables impacting the energy sector. These capabilities will be further augmented in the near future with the addition of a higher-resolution version of E3SMv1, as well as future predictive simulations.
E3SM v1 Model
E3SMv1 is the first version of the DOE Energy Exascale Earth System Model, a fully-coupled physical model designed to address DOE mission-relevant water cycle questions. In its standard-resolution configuration, E3SMv1 components include atmosphere and land (110 km grid spacing), ocean and sea ice (60 km in the mid-latitudes and 30 km at the equator and poles), and river transport (55 km) models. E3SMv1 was branched from the Community Earth System Model (CESM1) and has evolved significantly since; notable changes include:
- E3SM Atmosphere Model (EAMv1) component with a spectral-element (SE) dynamical core, increased vertical resolution, and substantially revamped physics and the capability of regional grid refinement.
- New ocean and sea-ice components based on the Model for Prediction Across Scales (MPAS) framework that uses Spherical Centroidal Voronoi Tessellations (SCVTs) for multi-resolution modeling.
- New river transport model, Model for Scale Adaptive River Transport (MOSART), for a more physically based representation of riverine processes.
- E3SMv1 land model (ELM), based on the Community Land Model Version 4.5 (CLM4.5) with new options for representing soil hydrology and biogeochemistry.
The performance of E3SMv1 is evaluated by means of a standard set of Coupled Model Intercomparison Project Phase 6 Diagnosis, Evaluation, and Characterization of Klima (CMIP6 DECK) simulations. The DECK simulations are a core set of simulations that are performed by all of the models participating in CMIP6 in order to maintain continuity with previous intercomparisons and help document the basic characteristics of the models. These simulations represent a total of nearly 3000 simulated years and are part of DOE’s contributions to CMIP6 (see table).
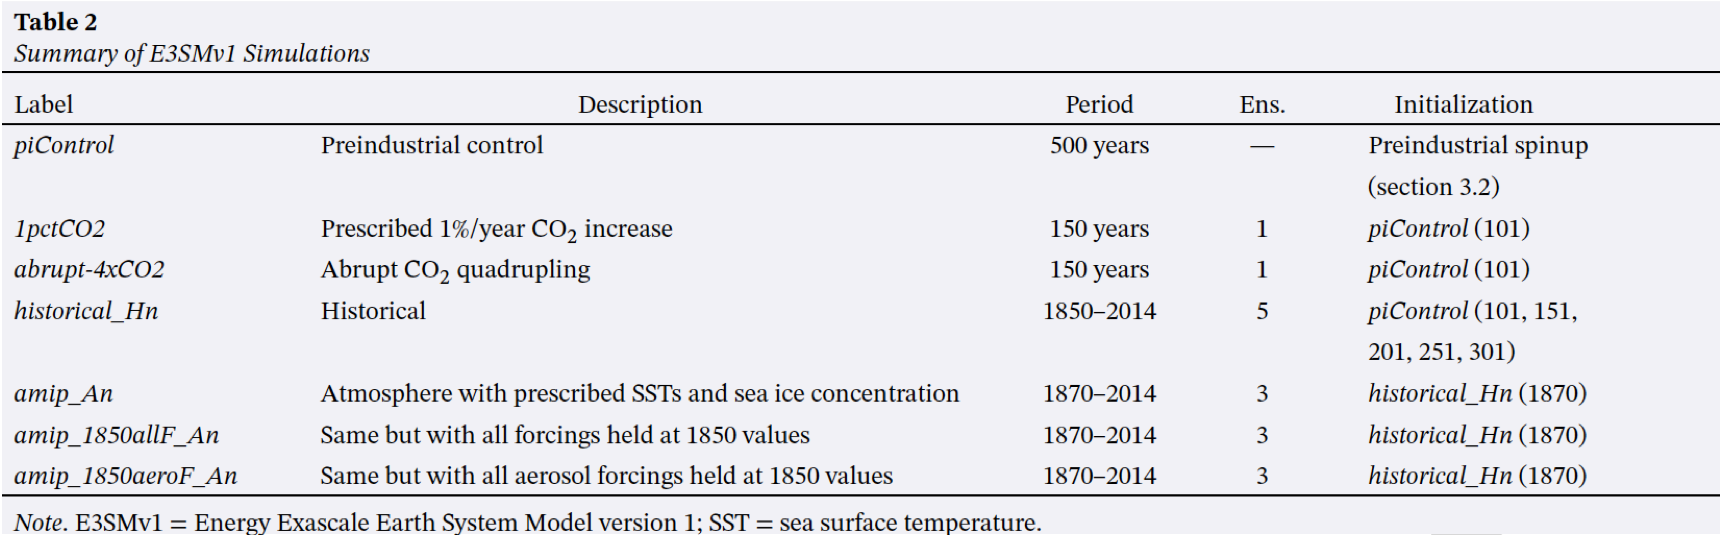
Table summarizing nearly 3000 simulated years of E3SM v1 CMIP6 DECK simulations performed at standard resolution.
Summary of the Results
The performance of E3SMv1 is examined with a set of experiments from the CMIP6 DECK. The simulated earth system over the course of the multi-century (500 years) pre-industrial control simulation is stable. Net energy flux at the top of the atmosphere (TOA) is close to zero (Fig. 1a) as expected for pre-industrial conditions. The global mean surface air temperature exhibits only a minor drift over the course of the entire 500 years (+0.013 K/century), and an even smaller drift over the last 400 years (-0.003 K/century; Fig 1b). Seasonal range in sea ice area (maximum vs minimum) is stable for both the Arctic and the Antarctic with no long-term trend (Fig. 1c).

Comparison of root mean square error (RMSE) for E3SMv1 (blue dots) vs CMIP5 models (box and whiskers). Red dots are E3SMv1 results with observed SSTs . Lower is better (RMSE). Fields shown include TOA net radiation (a), TOA SW and LW cloud radiative effects (b,c), precipitation (d), surface air temperature over land (e), zonal wind stress over ocean (f), 200 and 850 hPa zonal wind (g,h) and 500 hPa geopotential height (i).
The present-day earth system compares favorably with an ensemble of 45 CMIP5 models (Fig. 2). For most atmospheric variables, E3SMv1 falls within the top 25-percentile. But E3SMv1 is also subject to biases common to many models (e.g., stratocumulus coverage, double Intertropical Convergence Zone (ITCZ), weak Atlantic Meridional Overturning Circulation, excessive sea ice concentrations in the Labrador Sea).
E3SMv1 has a much-improved representation of the Madden Julian Oscillation (MJO) in strength, propagation characteristics and the explained intra-seasonal variance compared to CESM1. The MJO is generally thought to play a role in ENSO initiation, monsoon active break cycles, tropical cyclogenesis and remote teleconnection effects, therefore its accurate simulation is key. E3SMv1 also simulates well the frequency and spatial pattern associated with ENSO events which have considerable impact on North American precipitation.
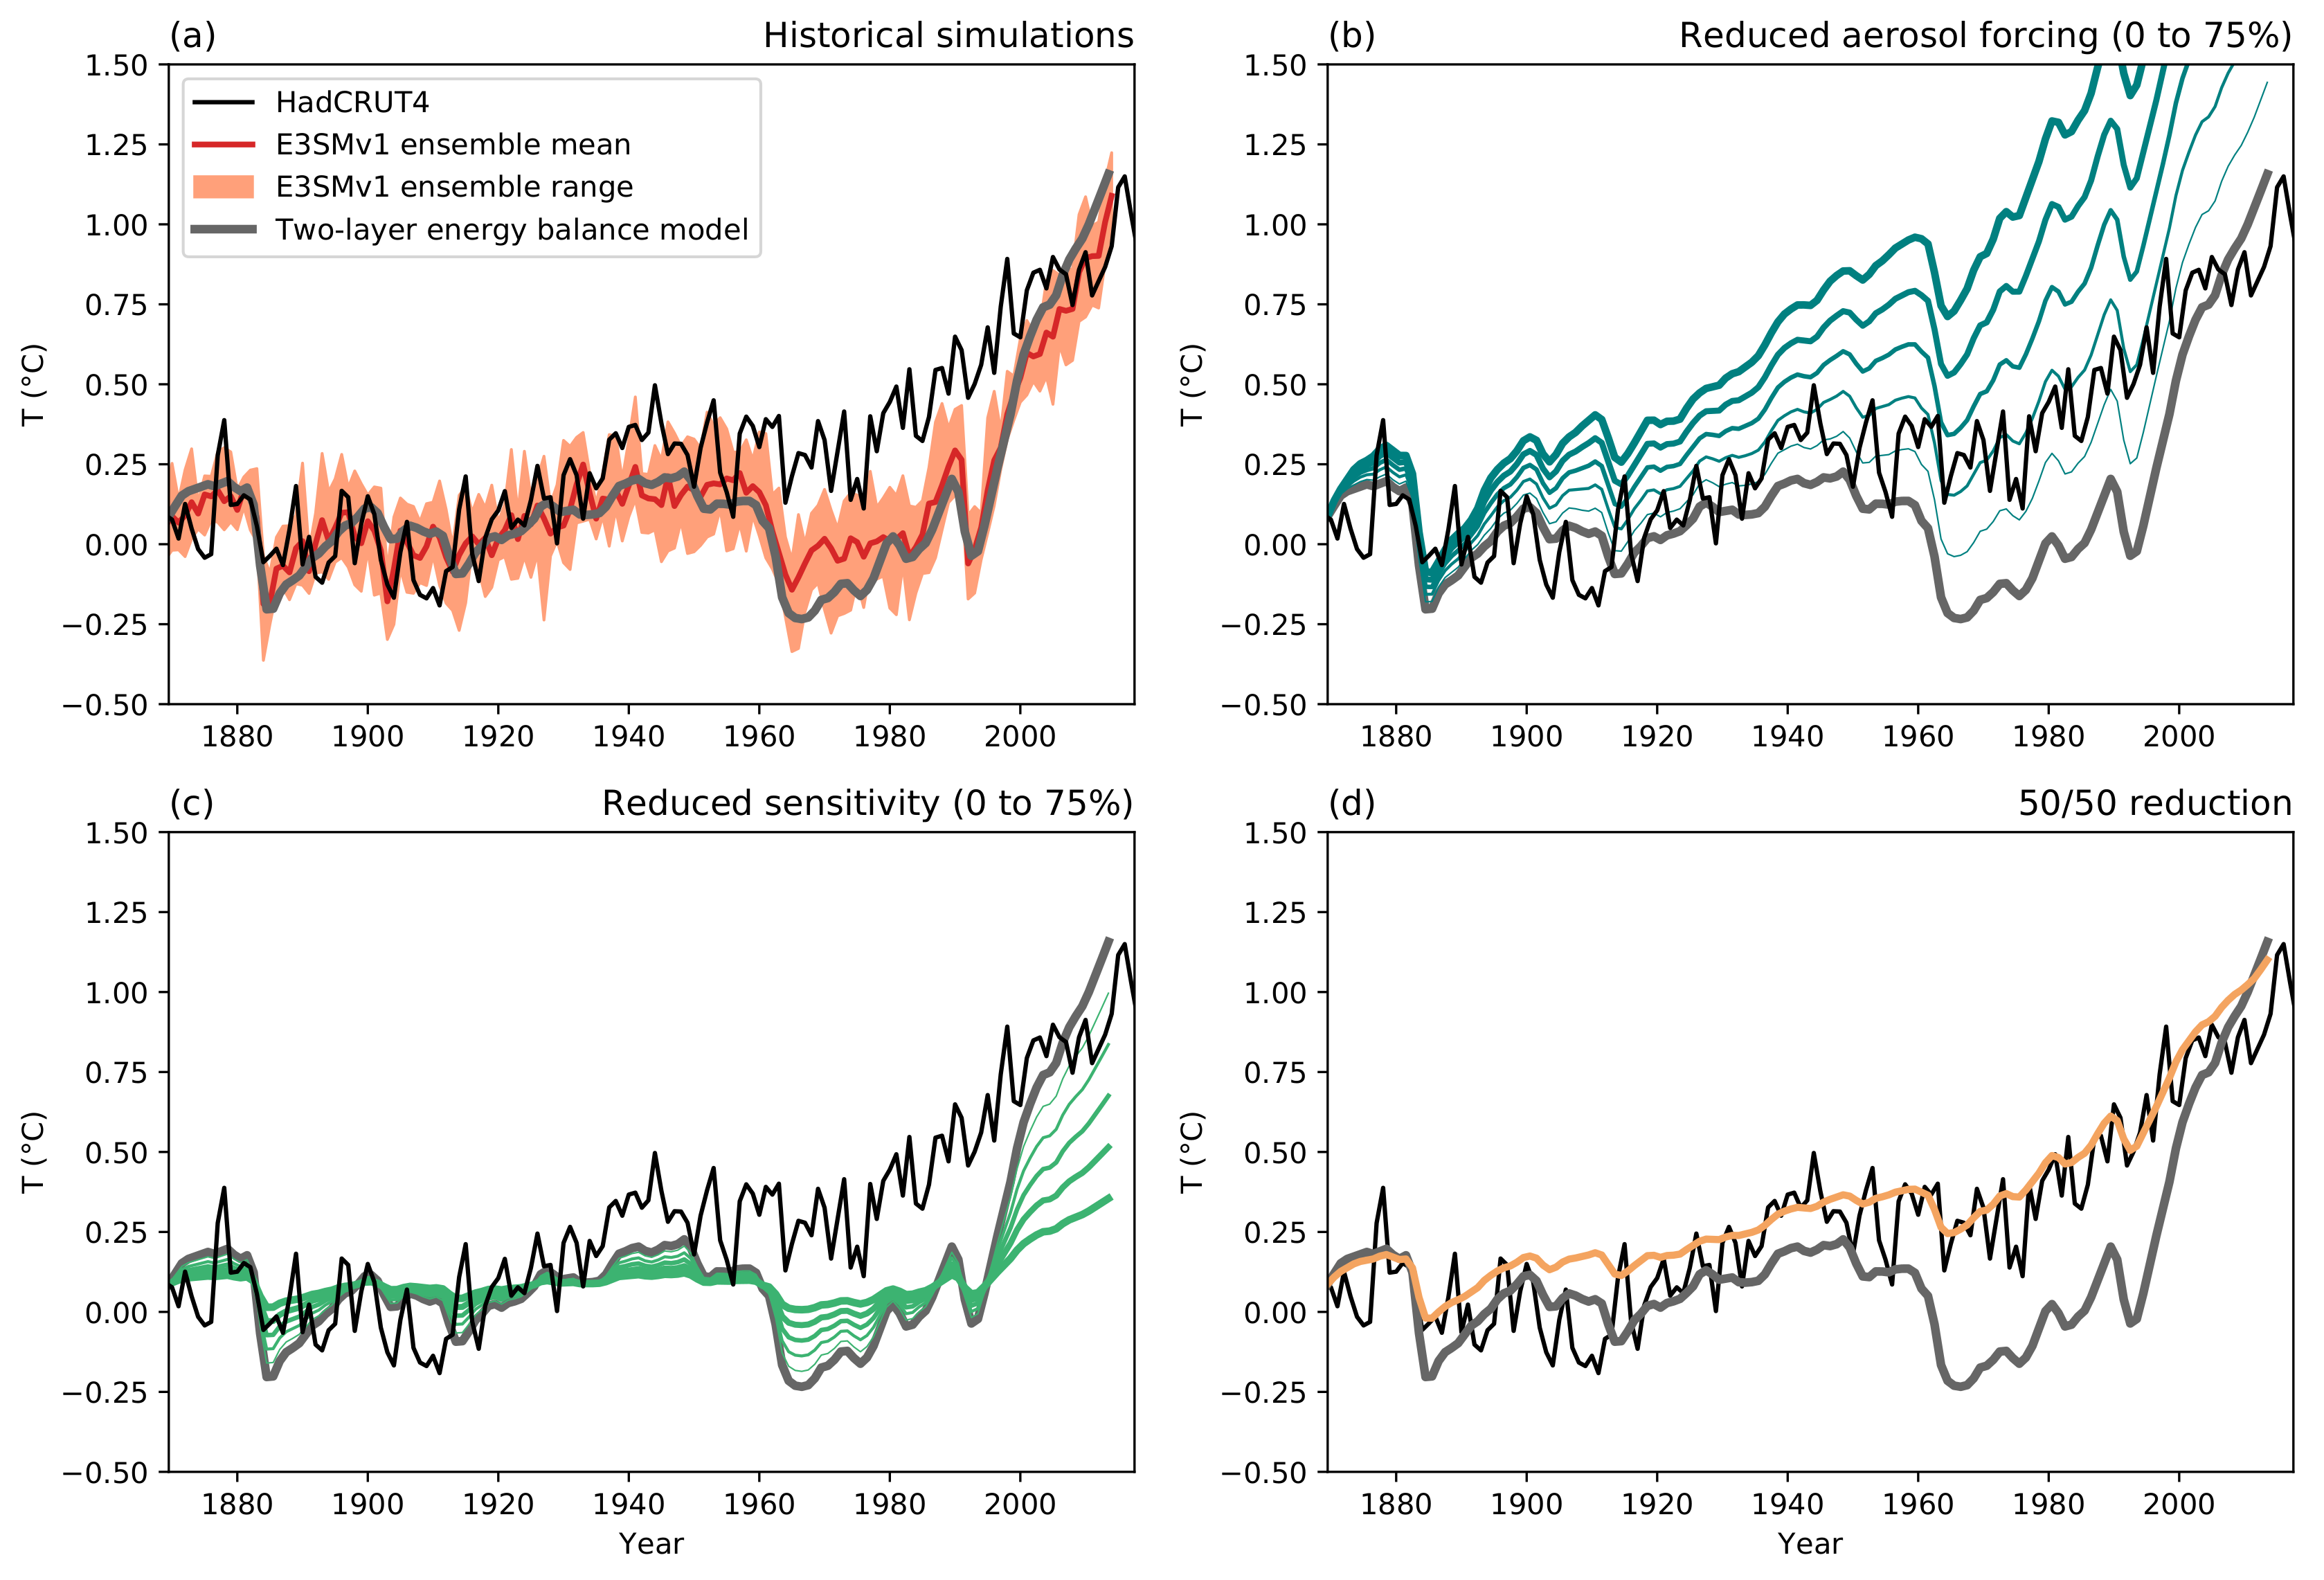
Time evolution of annual global mean surface air temperature anomalies. (a): Observations (black), E3SMv1 ensemble mean and range (red and orange), two-layer energy balance model (gray). (b): Energy Balance Model (EBM) with reduced aerosol forcing (0% to 75% in 15% increments; blue with increasing line thicknesses). (c): EBM with reduced sensitivity (0% to 75%; green with increasing line thicknesses). (d): EBM with 50% reduction in both aerosol forcing and sensitivity (brown).
Historical simulations capture the bulk of the observed warming from 1850 to 2014, but the warming diverges from observations in the second half of the 20th century with a period of delayed warming followed by an excessive warming trend. The authors attribute this to the model’s strong aerosol-related effective radiative forcing (ERFari+aci = -1.65 W m−2) and high equilibrium sensitivity (ECS = 5.3 K) (Fig. 3).
Publication
- Golaz, J.-C., P. M. Caldwell, L. P. Van Roekel, M. R. Petersen, Q. Tang, J. D. Wolfe and co-authors (2019). The DOE E3SM coupled model version 1: Overview and evaluation at standard resolution. Journal of Advances in Modeling Earth Systems, 11. https://doi.org/10.1029/2018MS001603
E3SM Code
- E3SM code DOI: 10.11578/E3SM/dc.20180418.36
E3SM Data
- CMIP6 Data on ESGF: https://esgf-node.llnl.gov/search/cmip6/?activity_id=CMIP&source_id=E3SM-1-0
- All E3SM Data on ESGF: https://esgf-node.llnl.gov/projects/e3sm/
Contact
Chris Golaz
Lawrence Livermore National Laboratory
golaz1@llnl.gov