

Impact of Nudging Strategies on Constrained EAMv1 Simulations
Quantifying, attributing, and reducing biases in global climate models is a difficult task. Interactions between different physical processes in the atmosphere lead to nonlinear variabilities in the observed and simulated atmospheric states, causing noise that can hinder signal detection, hide compensating errors in the models, and complicate the comparison between model results and observational data. These difficulties can be alleviated by constraining a numerical experiment through nudging of the atmospheric state towards prescribed meteorological data so that the evolution of the simulation follows a specific pathway. Such constrained simulations also provide a unique opportunity for understanding model biases/sensitivities at short time scales under specific meteorological conditions. A recent study, Sun et al., 2019, performed and analyzed sensitivity experiments in an attempt to identify implementations of the simulation strategy of nudging that can provide sufficient constraints without severely interfering with the simulations.
Approach
In Sun et al., 2019, sensitivity experiments were conducted with the Energy Exascale Earth System Model (E3SM) Atmosphere Model Version 1 (EAMv1) to identify configurations that can give results representative of the model’s long‐term climate while reasonably capturing characteristics of the observed weather events to facilitate the comparison of model results with measurements. A 5-year free-running simulation (after spin-up) was conducted as the reference simulation and is referred to as CLIM. Various nudged simulations were conducted, in which the constraining data were taken from the CLIM simulation, the ERA-Interim reanalysis, or the MERRA2 reanalysis. These nudged simulations are labeled as NDG_CLIM_xxx, NDG_ERA_xxx or NDG_MERRA2_xxx, with xxx indicating the nudging configuration. More details on the experimental design can be found in Sun et al., 2019.
Reproducing Weather Events
The ability of the nudged simulations to reproduce key features of the observed weather events was evaluated based on correlation between the simulations and the observations. The authors analyzed both the temporal and spatial correlation of the instantaneous atmospheric fields, calculated from temporal anomalies with respect to the monthly climatology. In Figure 1 shown below, the correlations are presented for various nudging configurations and 3 different latitude bands. The authors found that a nudged simulation can satisfactorily reproduce the characteristic evolution of the observed weather events in middle and high latitudes when the prescribed meteorological conditions are temporally interpolated to model time to constrain EAM’s horizontal winds (U and V) at each time step. Consistent with earlier experiences in the literature, nudging the horizontal winds towards the ERA-Interim reanalysis dataset (simulation NDG_ERA_UV) leads to very well-constrained large-scale circulation and temperature variations in the extratropics (correlation > 0.9, see first six pink squares from the left in the NDG_ERA_UV row of panels (a)-(d) in Figure 1). Adding temperature nudging (NDG_ERA_UVT) helps improve the model-observation correlations for both temperature (T) and the vertical velocity at 500 hPa (𝜔500), although the improvements are moderate. Nudging specific humidity (NDG_ERA_UVQ) leads to higher correlations for specific humidity (Q) itself and also for 𝜔500. Nudging Q also substantially improves the correlation between the simulated and observed tropical precipitation. However, as is shown in Figure 2, nudging either T or Q also leads to degradation of the climate representativeness in cloud radiative forcing, as well as in other meteorological fields (e.g. cloud amounts and precipitation, not shown).
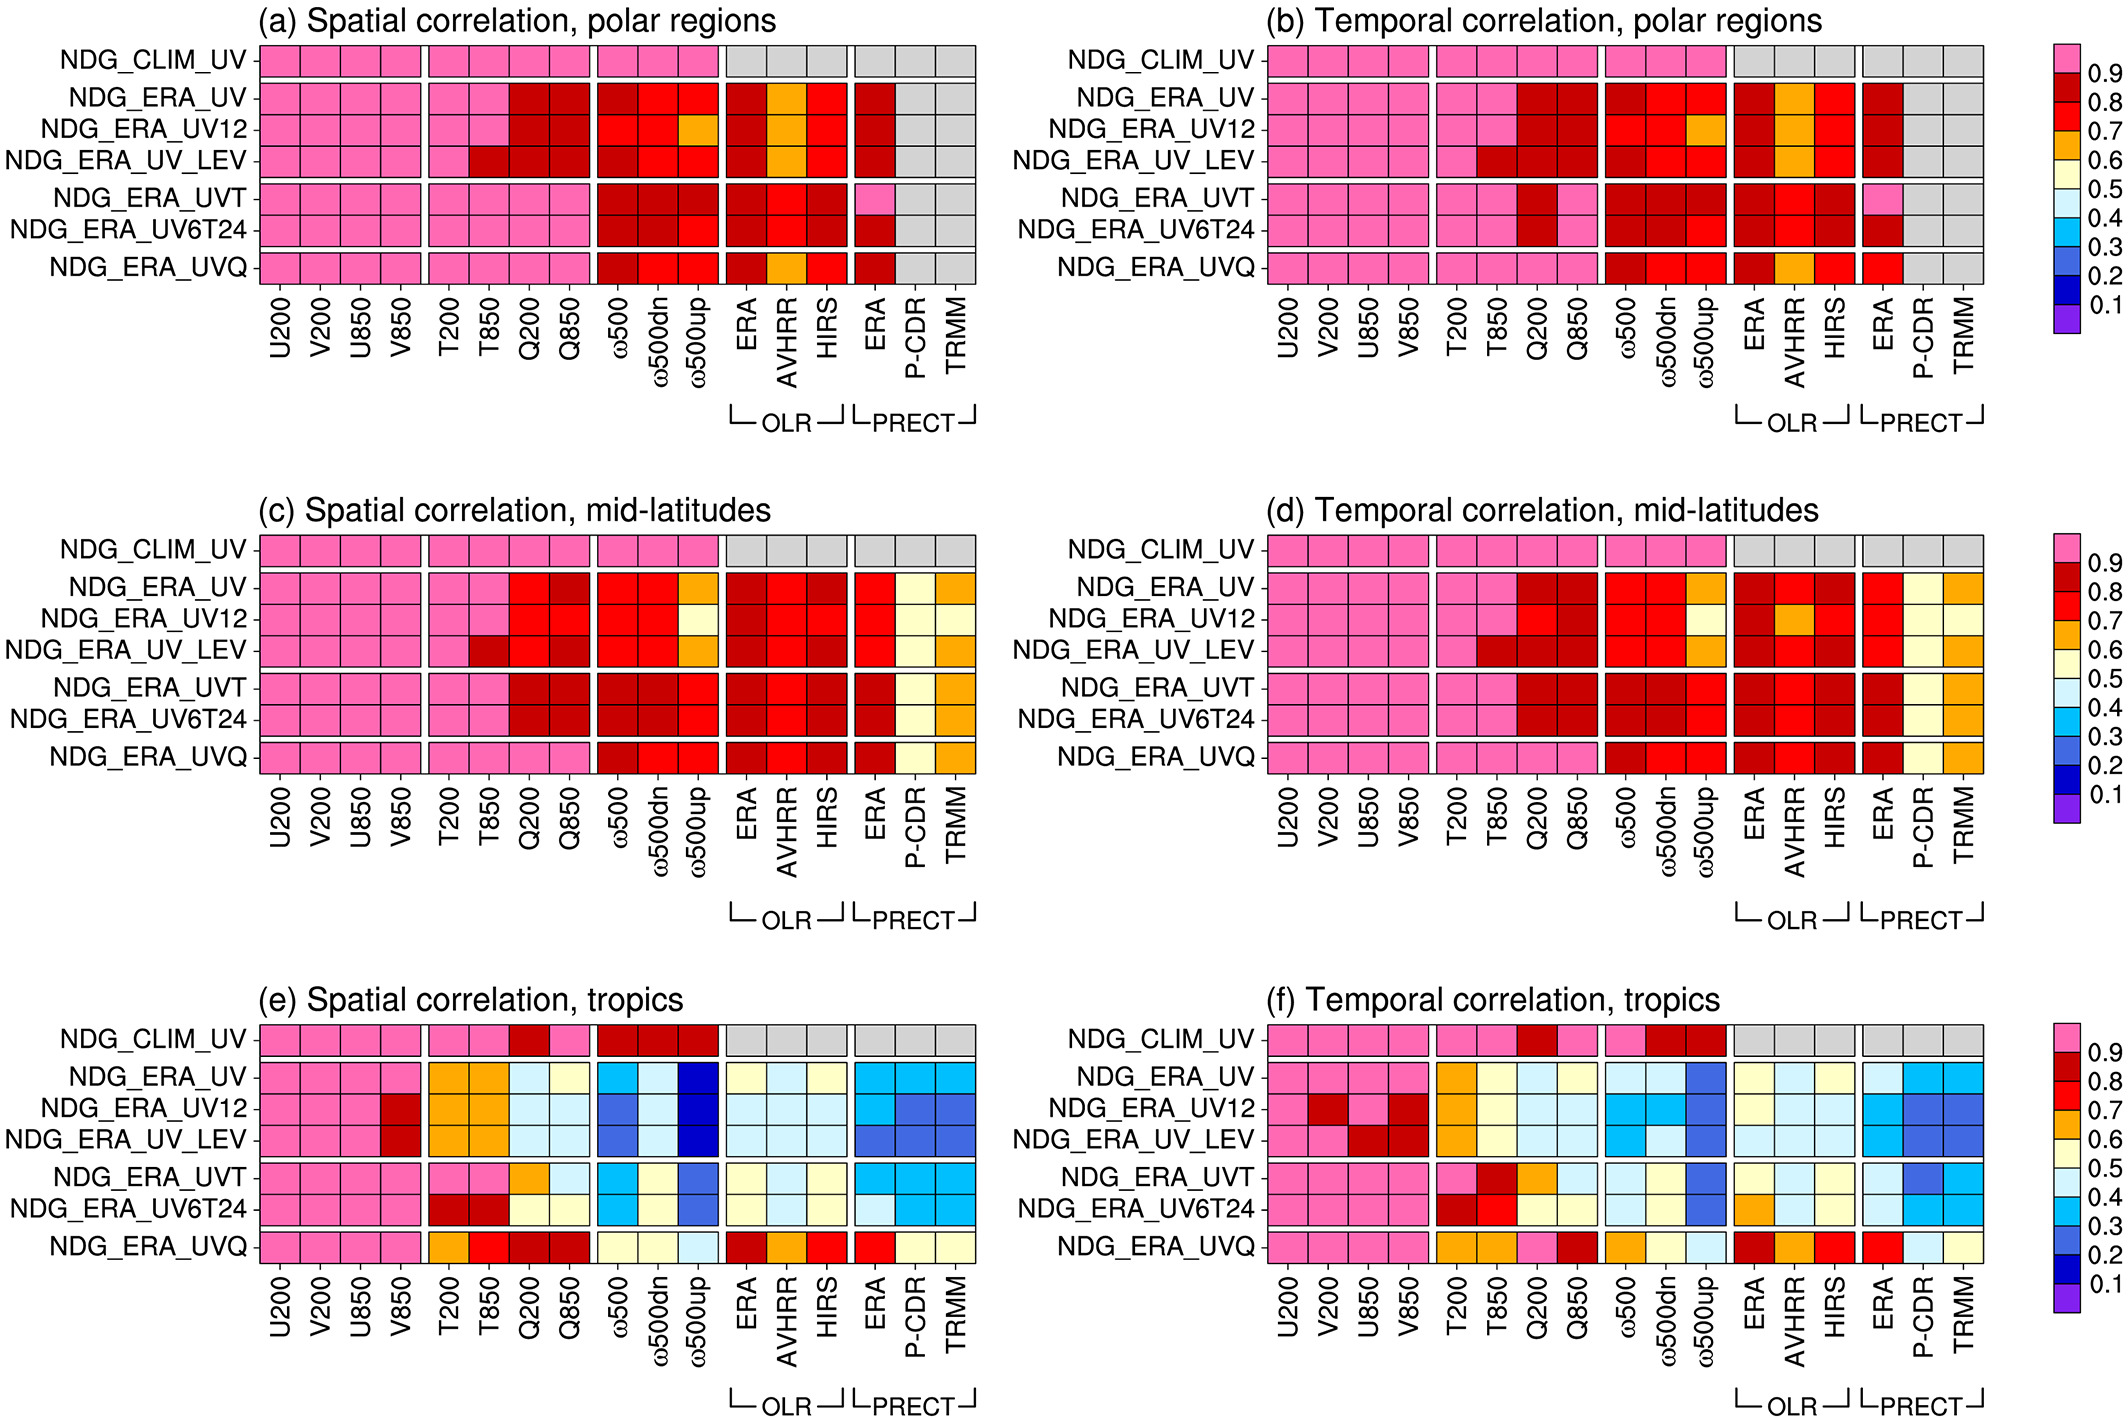
Figure 1. Left column: annual mean spatial correlation between nudged simulations and reanalysis or observations of selected physical quantities. Right column: as in the left column but showing the spatially averaged temporal correlation. The top, middle, and bottom rows correspond to the Polar Regions (60–90° S, 60–90° N), midlatitudes (30–60° S, 30–60° N), and tropics (20° S to 20° N), respectively. All correlations were calculated from anomalies with respect to the monthly climatology. The horizontal wind components (U and V), temperature (T), and specific humidity (Q) and vertical velocity (ω) are compared with ERA‐Interim. ω500up and ω500dn are results calculated from grid cells containing only upward or downward motion. Outgoing Longwave Radiation (OLR) and total precipitation (PRECT) are compared to ERA‐Interim as well as satellite products. Specifically, for OLR, model results are compared with ERA‐Interim (labeled as “ERA”), NOAA‐AVHRR (labeled as “AVHRR”), and NOAA‐HIRS (labeled as “HIRS”). For precipitation, model results are compared with ERA‐Interim (labeled as “ERA”), PERSIANN‐CDR (labeled as “P‐CDR”), and TRMM. Gray indicates missing values resulting from observational data being unavailable or model results not directly comparable with observation/reanalysis data.
Reproducing the Mean Climate
When only horizontal winds are nudged, the long‐term climatology of the nudged simulations appear to be very similar to that in the free-running simulation (CLIM), although nudging also leads to non-negligible regional changes in wind‐driven aerosol emissions, low‐level clouds in the stratocumulus regime, and cloud and precipitation near the maritime continent. For example, Figure 2 shows good agreement between the nudged simulation (NDG_ERA_UV, green in panels (a) and (b)) and the free-running simulation (CLIM, purple in panels (a) and (b)) for the zonally averaged annual mean longwave and shortwave cloud radiative forcing (LWCF and SWCF). EAMv1 is less sensitive to temperature nudging compared to its predecessor model used in an earlier study, although significant impacts on the cloud radiative effects still exist. EAMv1 remains very sensitive to humidity nudging; cloud fraction, cloud water path, and cloud radiative forcing change substantially when humidity is nudged. The humidity nudging (NDG_ERA_UVQ, red in panels (a) and (b)) is seen to introduce a weakening of LWCF by 10 W/m2 and SWCF by up to 25 W/m2, which is excessive. This is undesirable if the purpose of the numerical experiment is to diagnose biases in the free-running model. Very similar results are seen when a different reanalysis data set is used for nudging, i.e., MERRA2 instead of ERA-Interim, see bottom row of Figure 2. This suggests that the sensitivities to nudging strategy described above are larger than the discrepancies (uncertainties) between different reanalysis data sets.
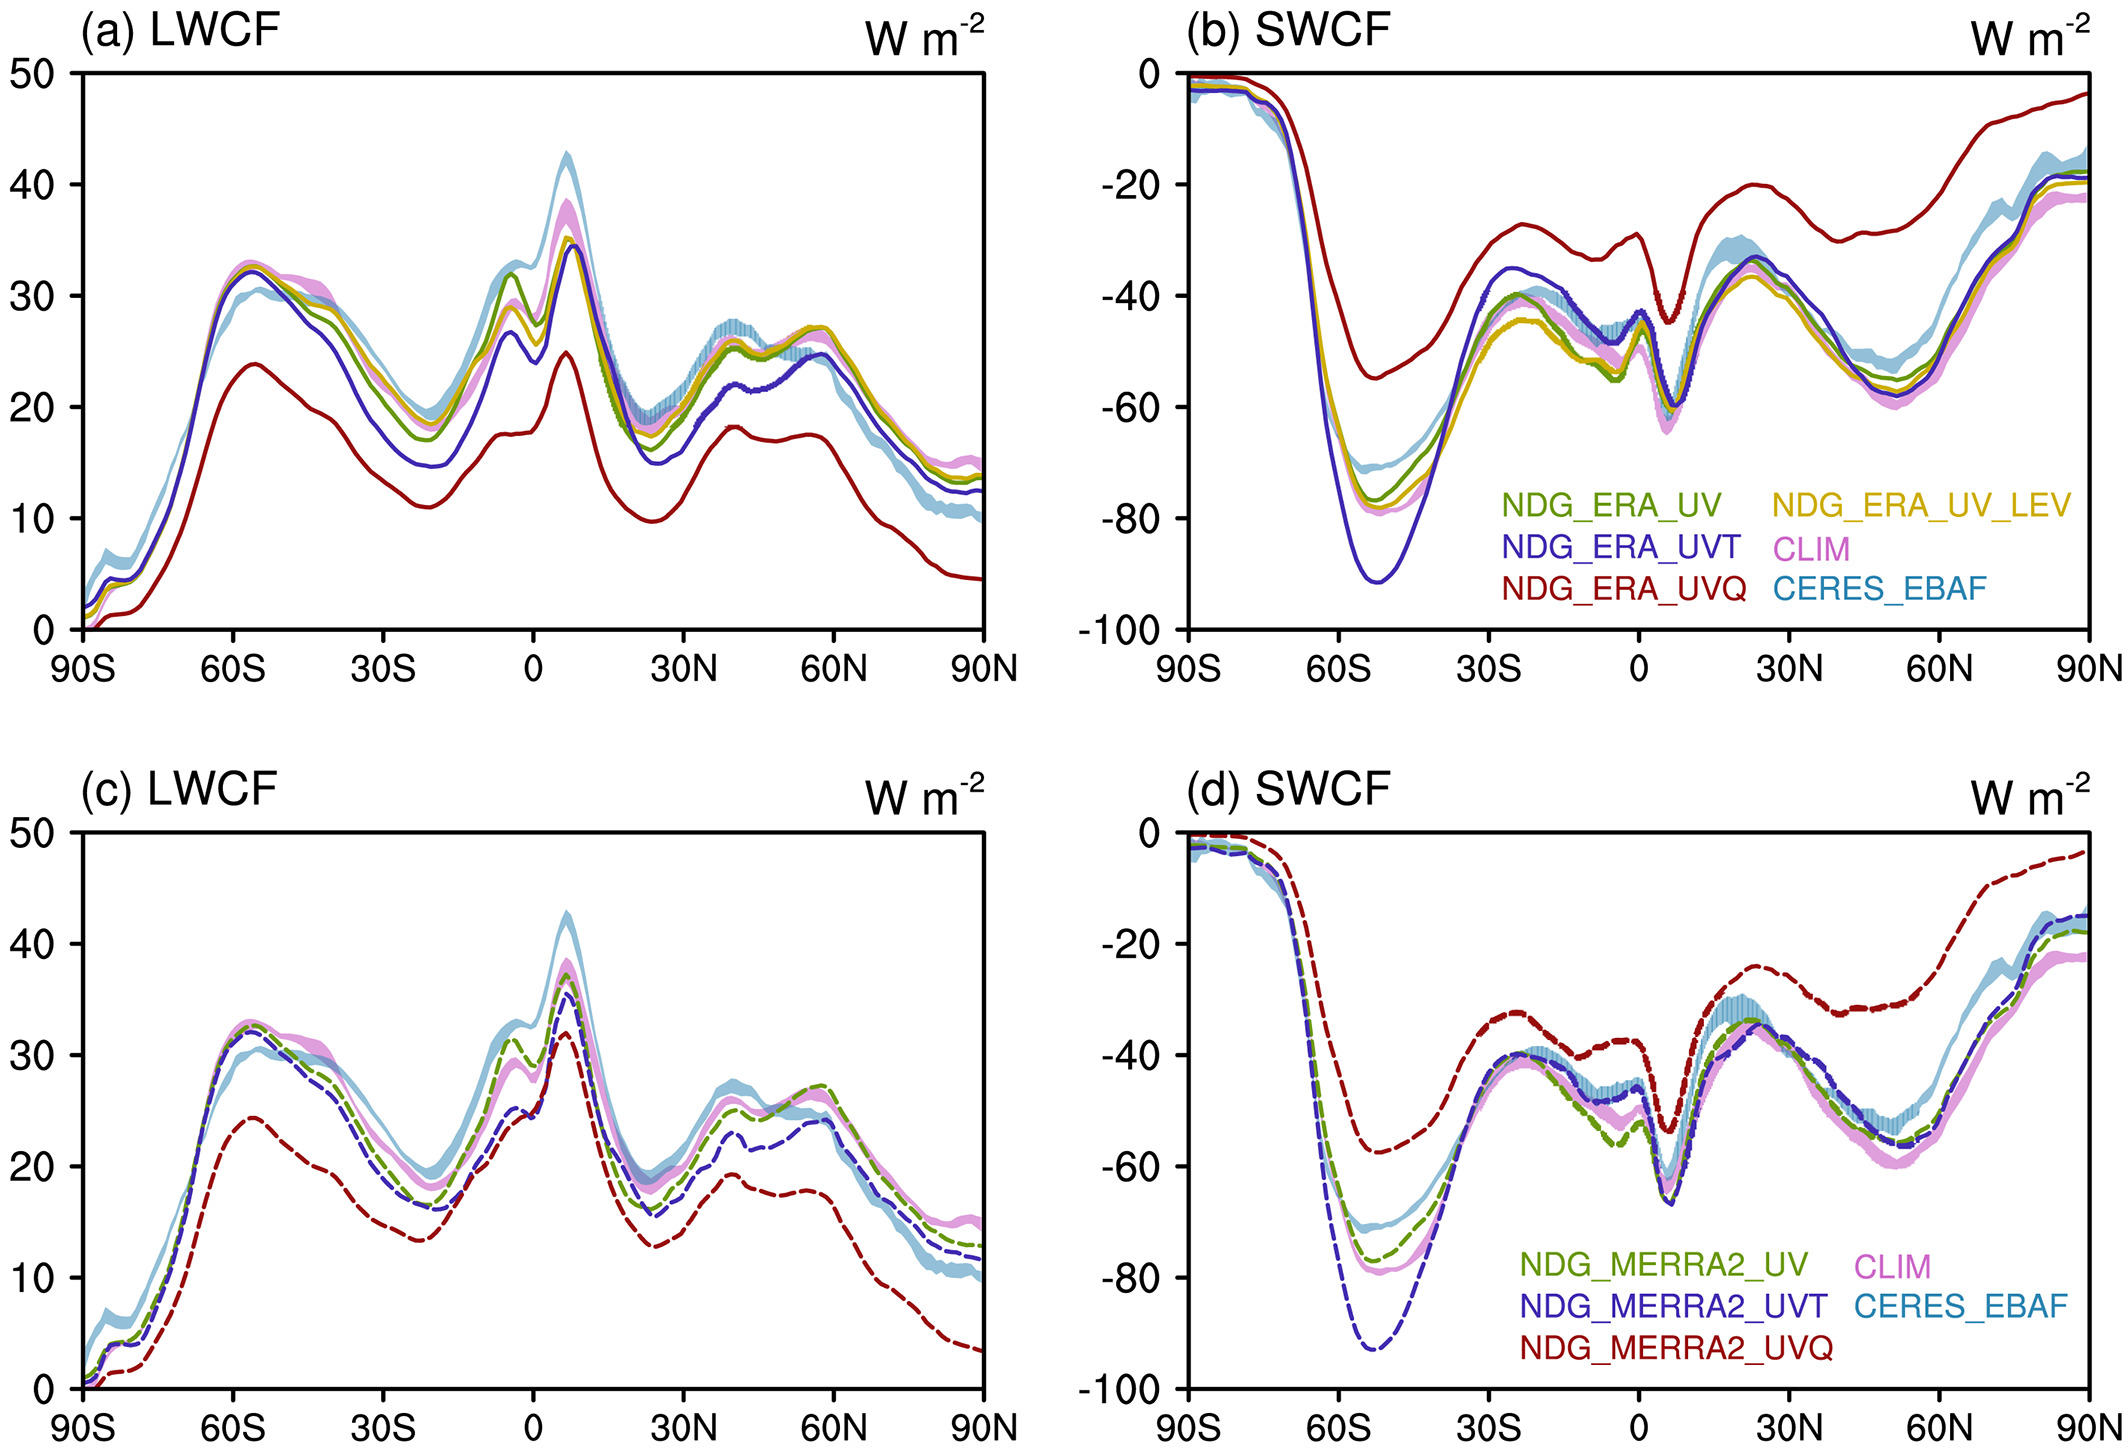
Zonally averaged annual mean longwave cloud forcing (LWCF, left column) and shortwave cloud forcing (SWCF, right column) in nudged (NDG_xxx) and free‐running (CLIM) EAMv1 simulations as well as from CERES‐EBAF. The year 2011 mean values from simulations nudged to the ERA-Interim reanalysis are shown in panels (a) and (b) as solid red, purple, and green lines without shading; the year 2011 mean values from simulations nudged to the MERRA2 reanalysis are shown in panels (c) and (d) as dashed red, purple, and green lines without shading. Shading in all panels indicates the minimum‐to‐maximum range of the annual averages in the 5‐year CLIM simulations and in the CERES_EBAF (2011‐2015) data.
Summary
Results show that carefully configured nudging can allow the EAM model to reproduce the characteristic evolution of observed weather events, while maintaining the statistical properties of the unconstrained climate simulations. Such nudged simulations can facilitate process-based evaluation of model fidelity and allow for detailed analysis without requiring years of simulation data, providing a valuable experimentation strategy for the development of high-resolution models. The improved nudging code is currently being integrated into the E3SM master branch and developers expect it to be released with E3SM version 2.
Publication
- Sun, J., Zhang, K., Wan, H., Ma, P.‐L., Tang, Q., & Zhang, S. (2019). Impact of nudging strategy on the climate representativeness and hindcast skill of constrained EAMv1 simulations. Journal of Advances in Modeling Earth Systems, 11, 3911– 3933. https://doi.org/10.1029/2019MS001831
Funding
- Energy Exascale Earth System Model (E3SM) project and the “ACME‐SM: A Global Climate Model Software Modernization Surge” project – U.S. Department of Energy (DOE), Office of Science, Office of Biological and Environmental Research (BER)
- PNNL Research Computing (RC)
- National Energy Research Scientific Computing Center (NERSC) – a DOE Office of Science User Facility supported by DOE’s Office of Science
- Laboratory Computing Resource Center at Argonne National Laboratory – BER Earth System Modeling program
Contact
- Kai Zhang, Pacific Northwest National Laboratory