

PACE
Performance Analytics for Computational Experiments (PACE)
Understanding computational performance of a complex coupled model like E3SM poses a singular challenge to domain and computational scientists. Toward that goal, researchers developed PACE (Performance Analytics for Computational Experiments), a framework to summarize performance data collected from E3SM experiments to derive insights and present them through a web portal. The PACE web portal is available at https://pace.ornl.gov/.
The primary goal of PACE is to serve as a central hub of performance data to provide an executive summary of E3SM experiment performance. Additionally, PACE is designed to enable the following capabilities:
- Interactive analyses and deep-dives into experiments and application sub-regions, as desired,
- Tracking performance benchmarks and simulation campaigns of interest,
- Facilitating performance research on load balancing and process layouts,
- Identification of bottlenecks to inform targeted optimization efforts.
PACE portal:
Methodology and Infrastructure
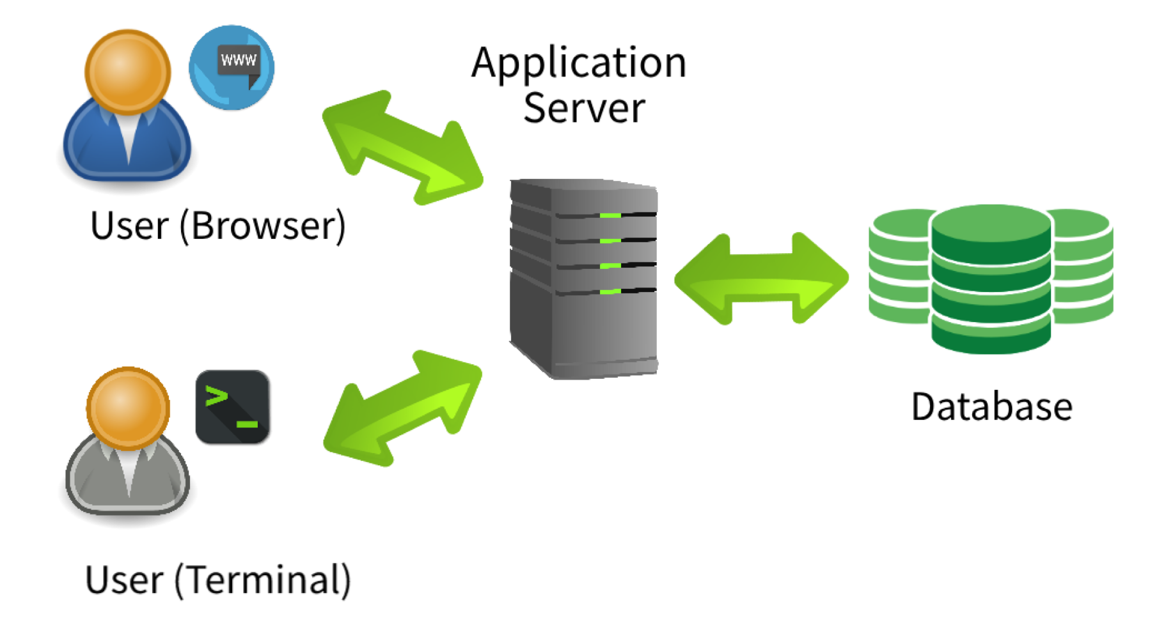
Overview of the PACE design. E3SM users or machine points-of-contact upload experiment data through a terminal from DOE supercomputers, then users can interactively explore performance data through the PACE web portal.
The E3SM model incorporates a lightweight performance tracking capability by default. This tracking/profiling capability is provided by designating various application sections of interest using start and stop markers based on the General Purpose Timing Library (GPTL). Whenever an E3SM user runs an experiment on a supported DOE supercomputer, provenance and performance data is automatically collected and archived in project-wide locations. Such aggregated performance data is periodically uploaded to a central server and made accessible to E3SM users and performance specialists through the PACE web portal. PACE is comprised of: a MariaDB database to store structured and unstructured experiment outputs; a MinIO high performance object storage server for storing raw data; various tools in the Python ecosystem for the backend infrastructure and middleware; and JavaScript tools for frontend and visual analytics.
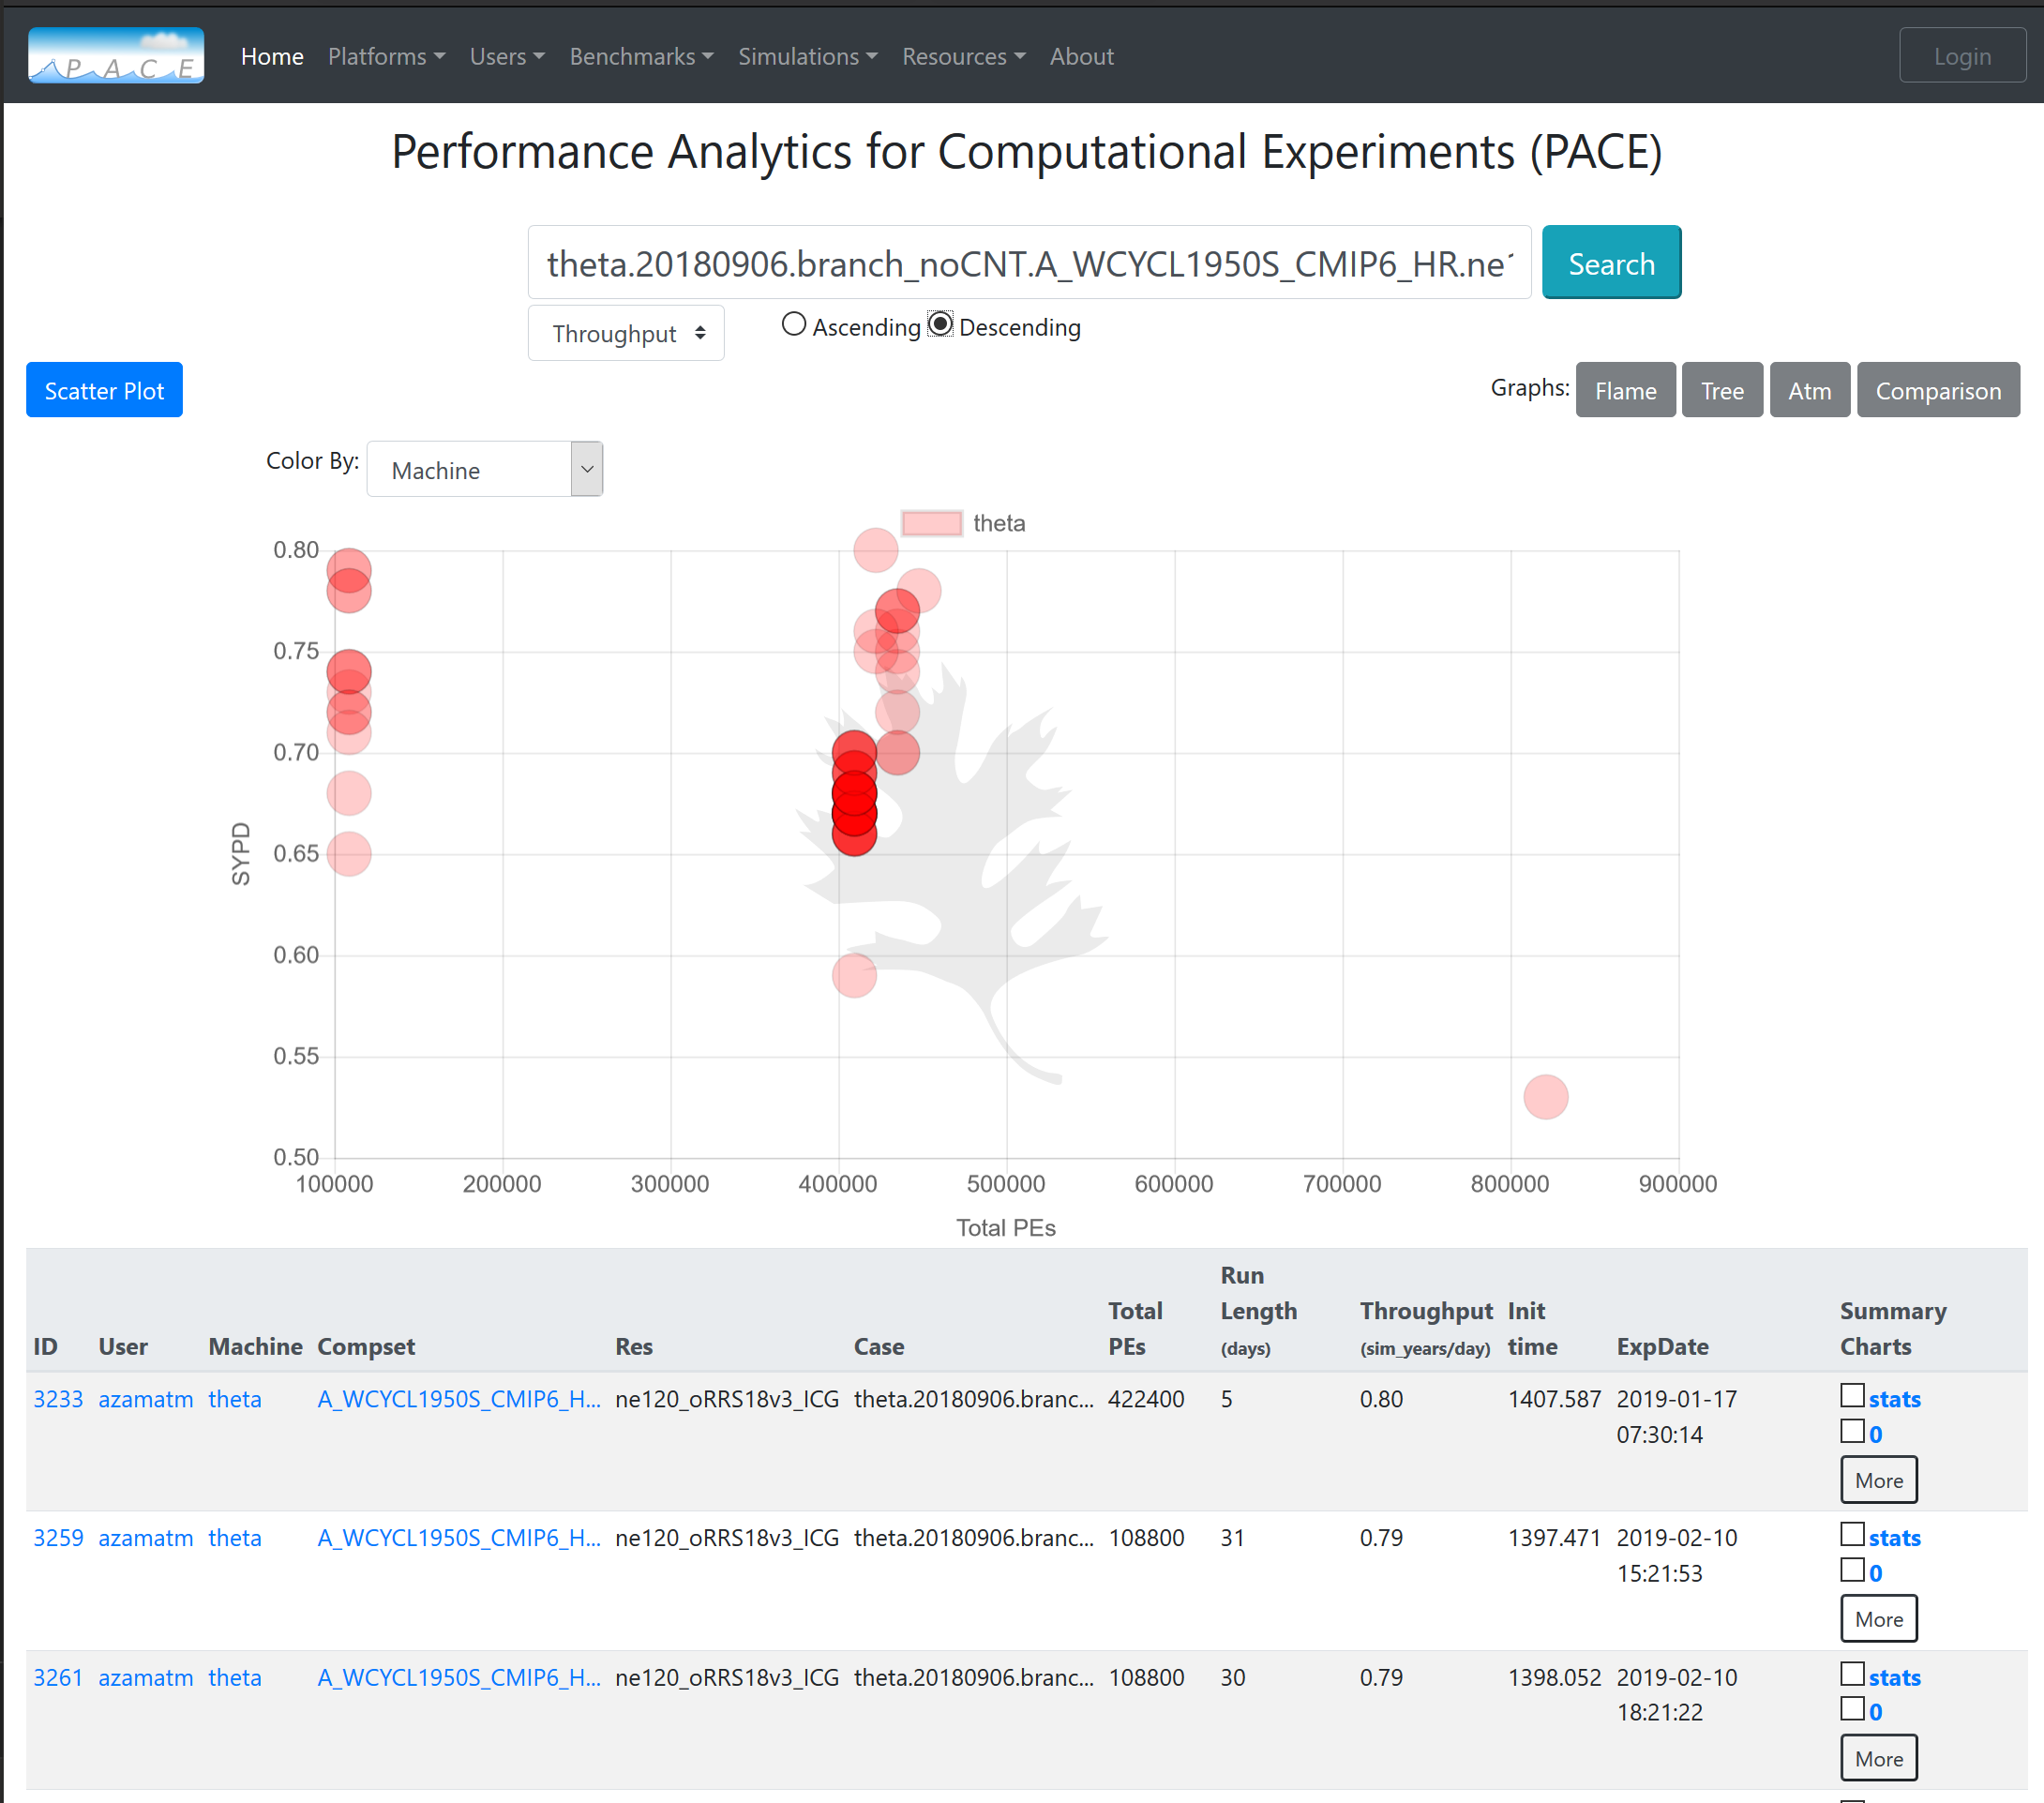
Simulation year per day (SYPD) versus total number of processors for High-res Water Cycle simulations on Theta, along with search results.
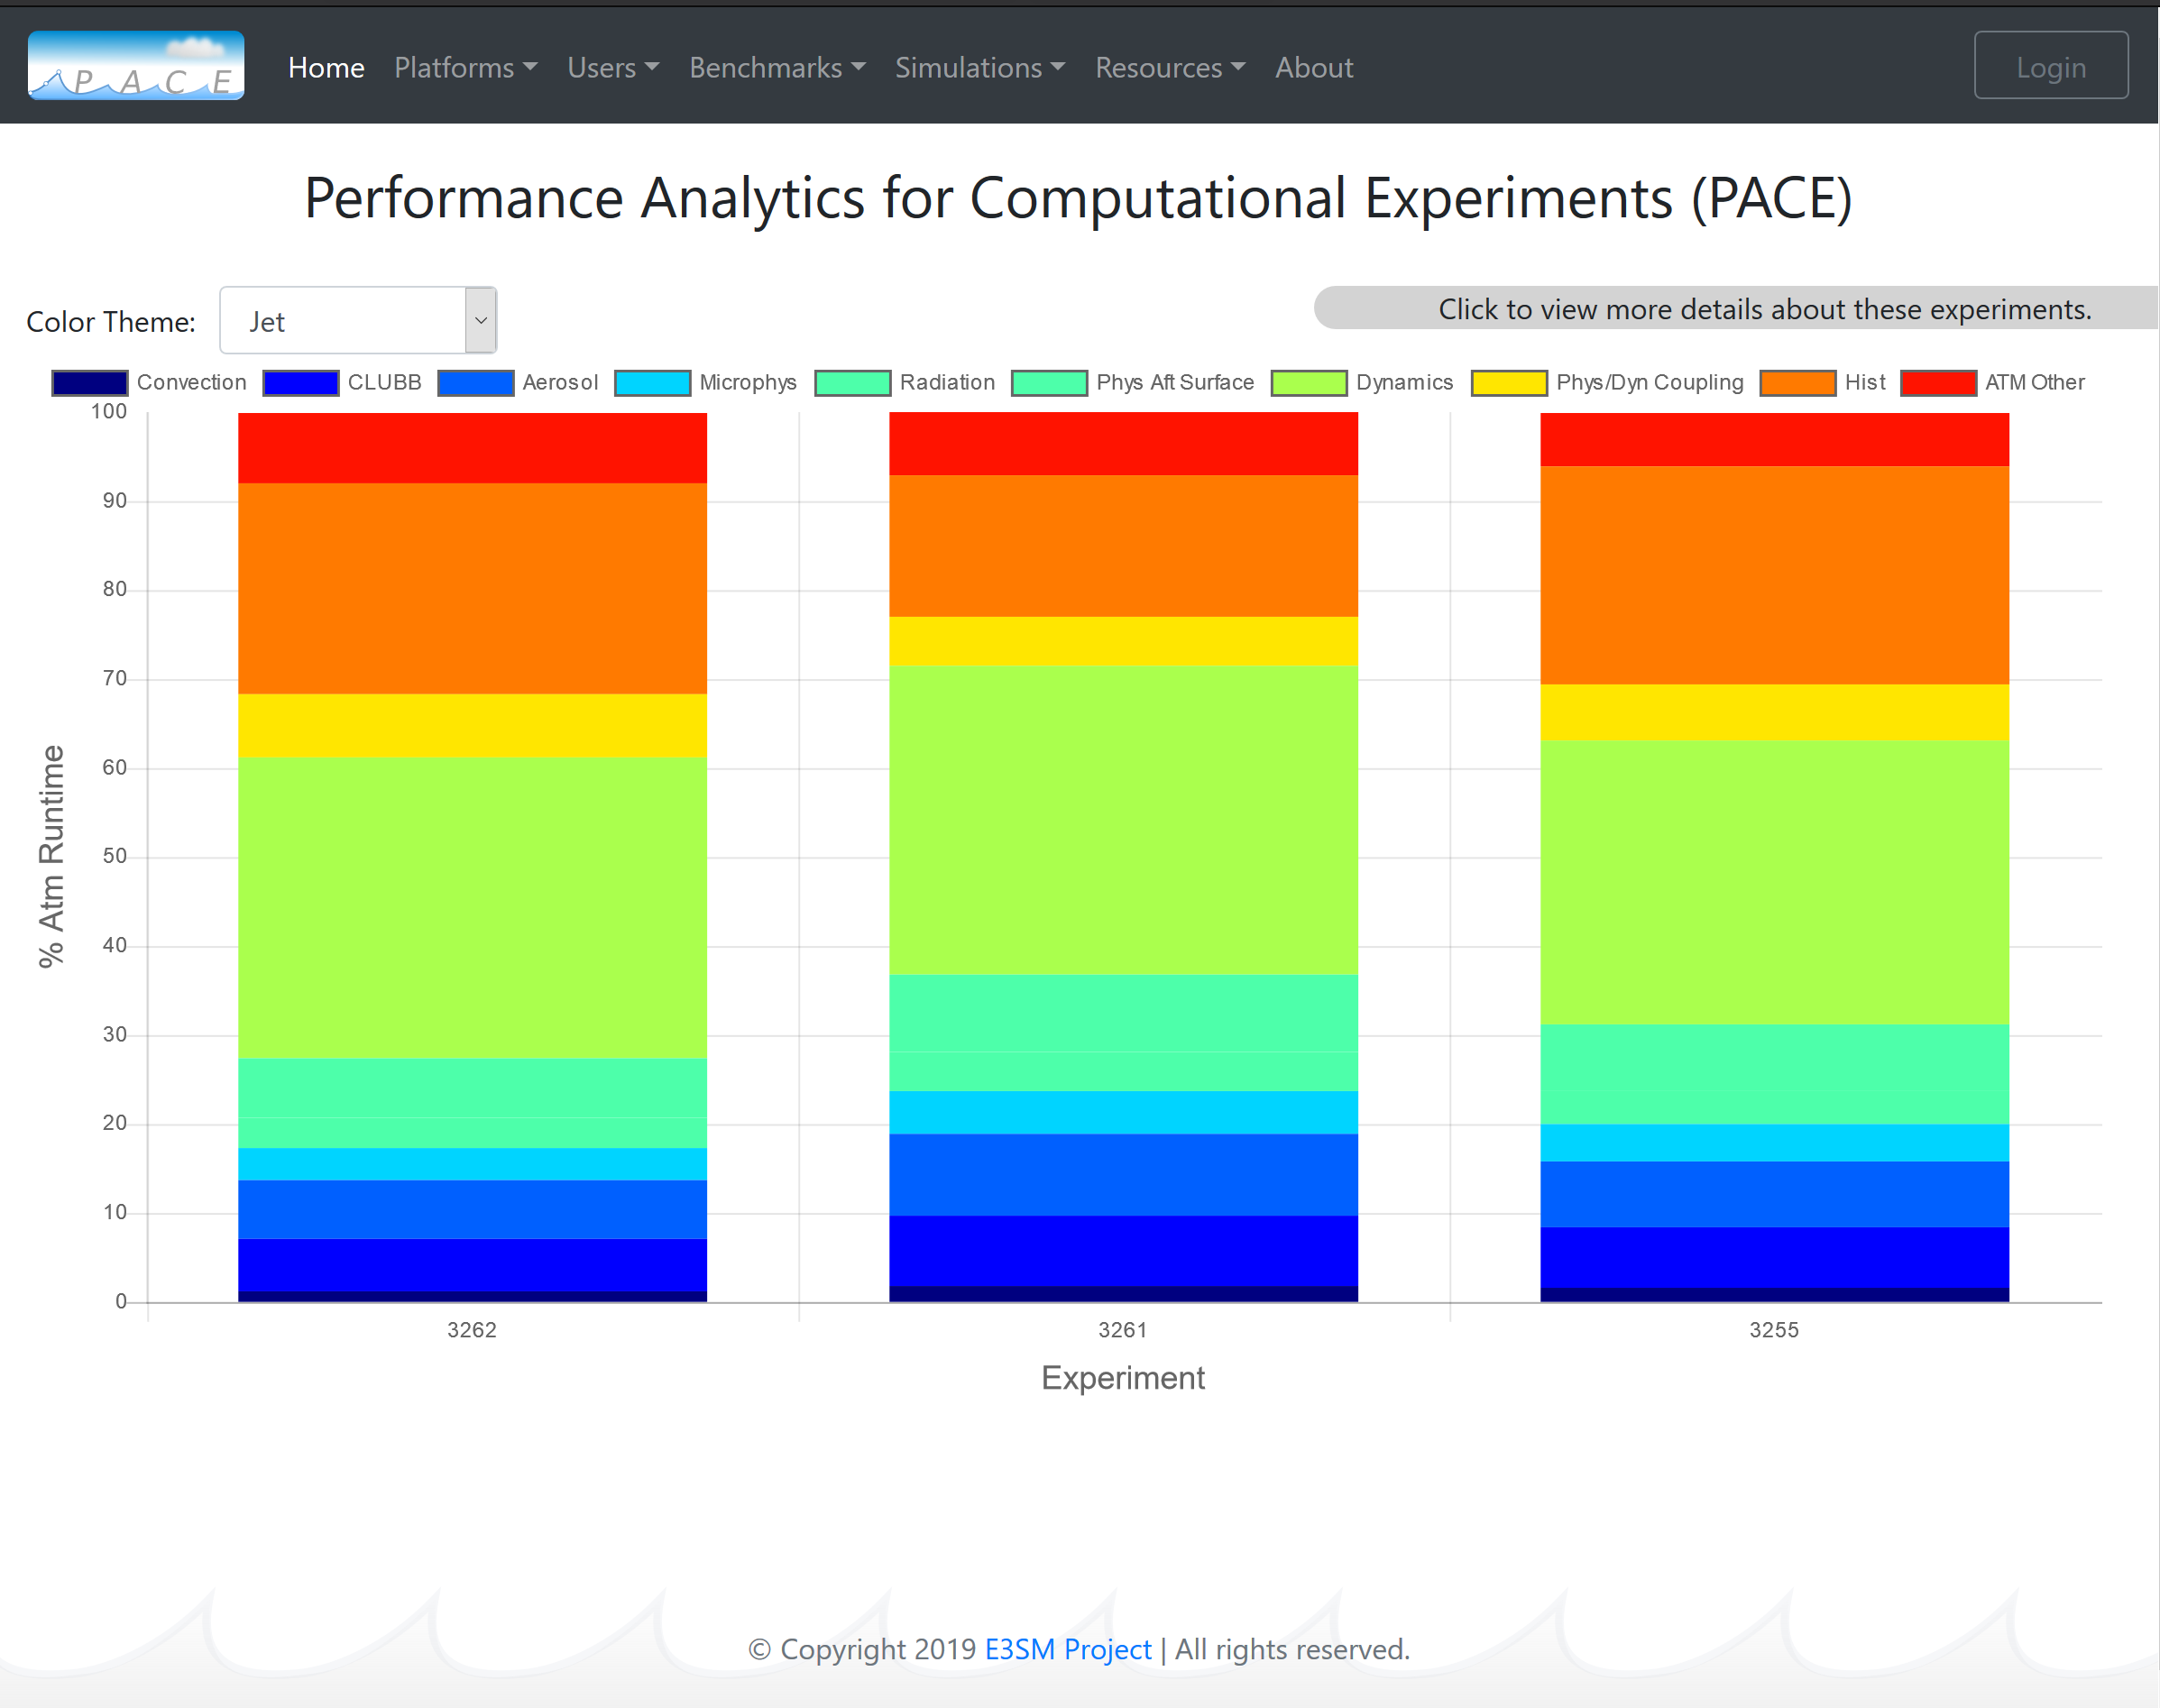
A timing comparison of the atmosphere sub-components across multiple experiments from the High Resolution Water Cycle simulation campaign.
Experiment Upload
All members of the E3SM project can upload their experiments’ performance data through a streamlined process. For instructions on how to upload experiments, see the Upload How-To page and the PACE Upload demonstration video.
A simple client-side tool, ‘pace-upload’ is provided to facilitate validation and aggregation of completed experiments to be uploaded to the central server. This tool authenticates users through their Github credentials and provides upload authorization only to E3SM project members. The tool caches/saves a user’s credentials to make recurring uploads easier. The PACE server ingests the performance data from an uploaded experiment to store associated provenance and performance in a database. The raw experiment data is parsed to populate various database tables to facilitate visual analytics and interactive performance exploration.
Web Portal Features
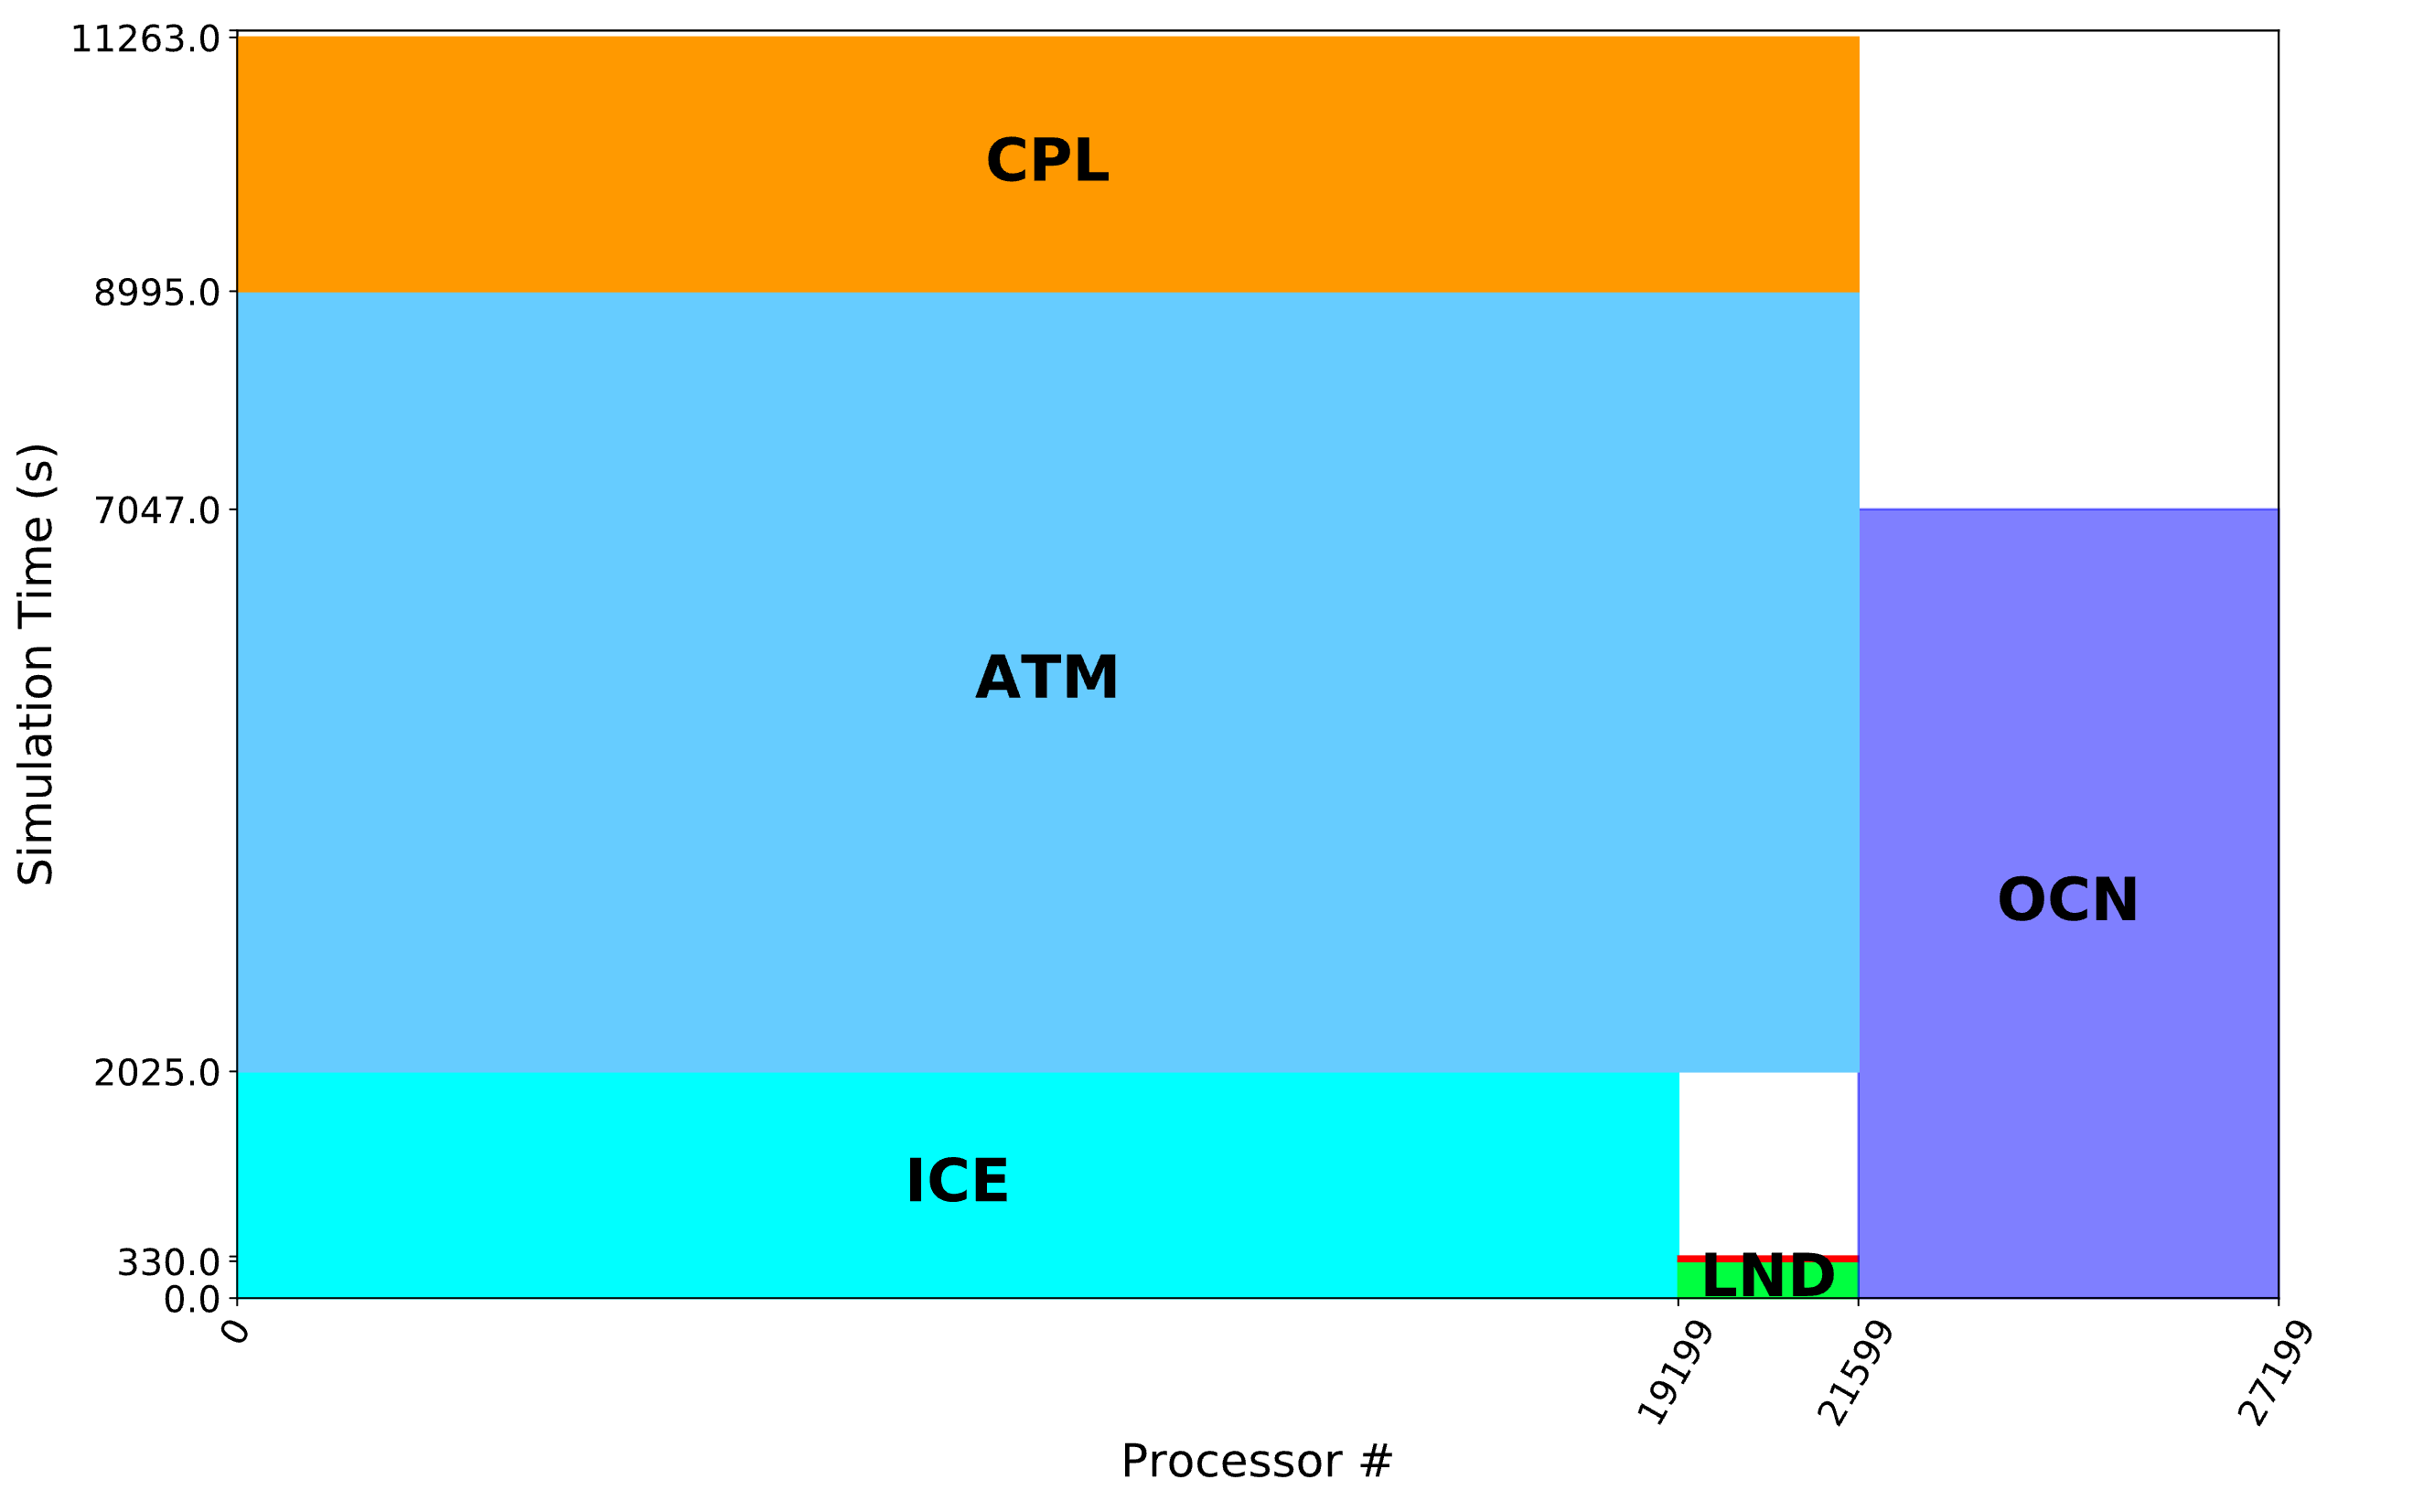
Example of a PACE “experiment details view” that shows the mapping of parallel processes to model components along with simulation time spent.
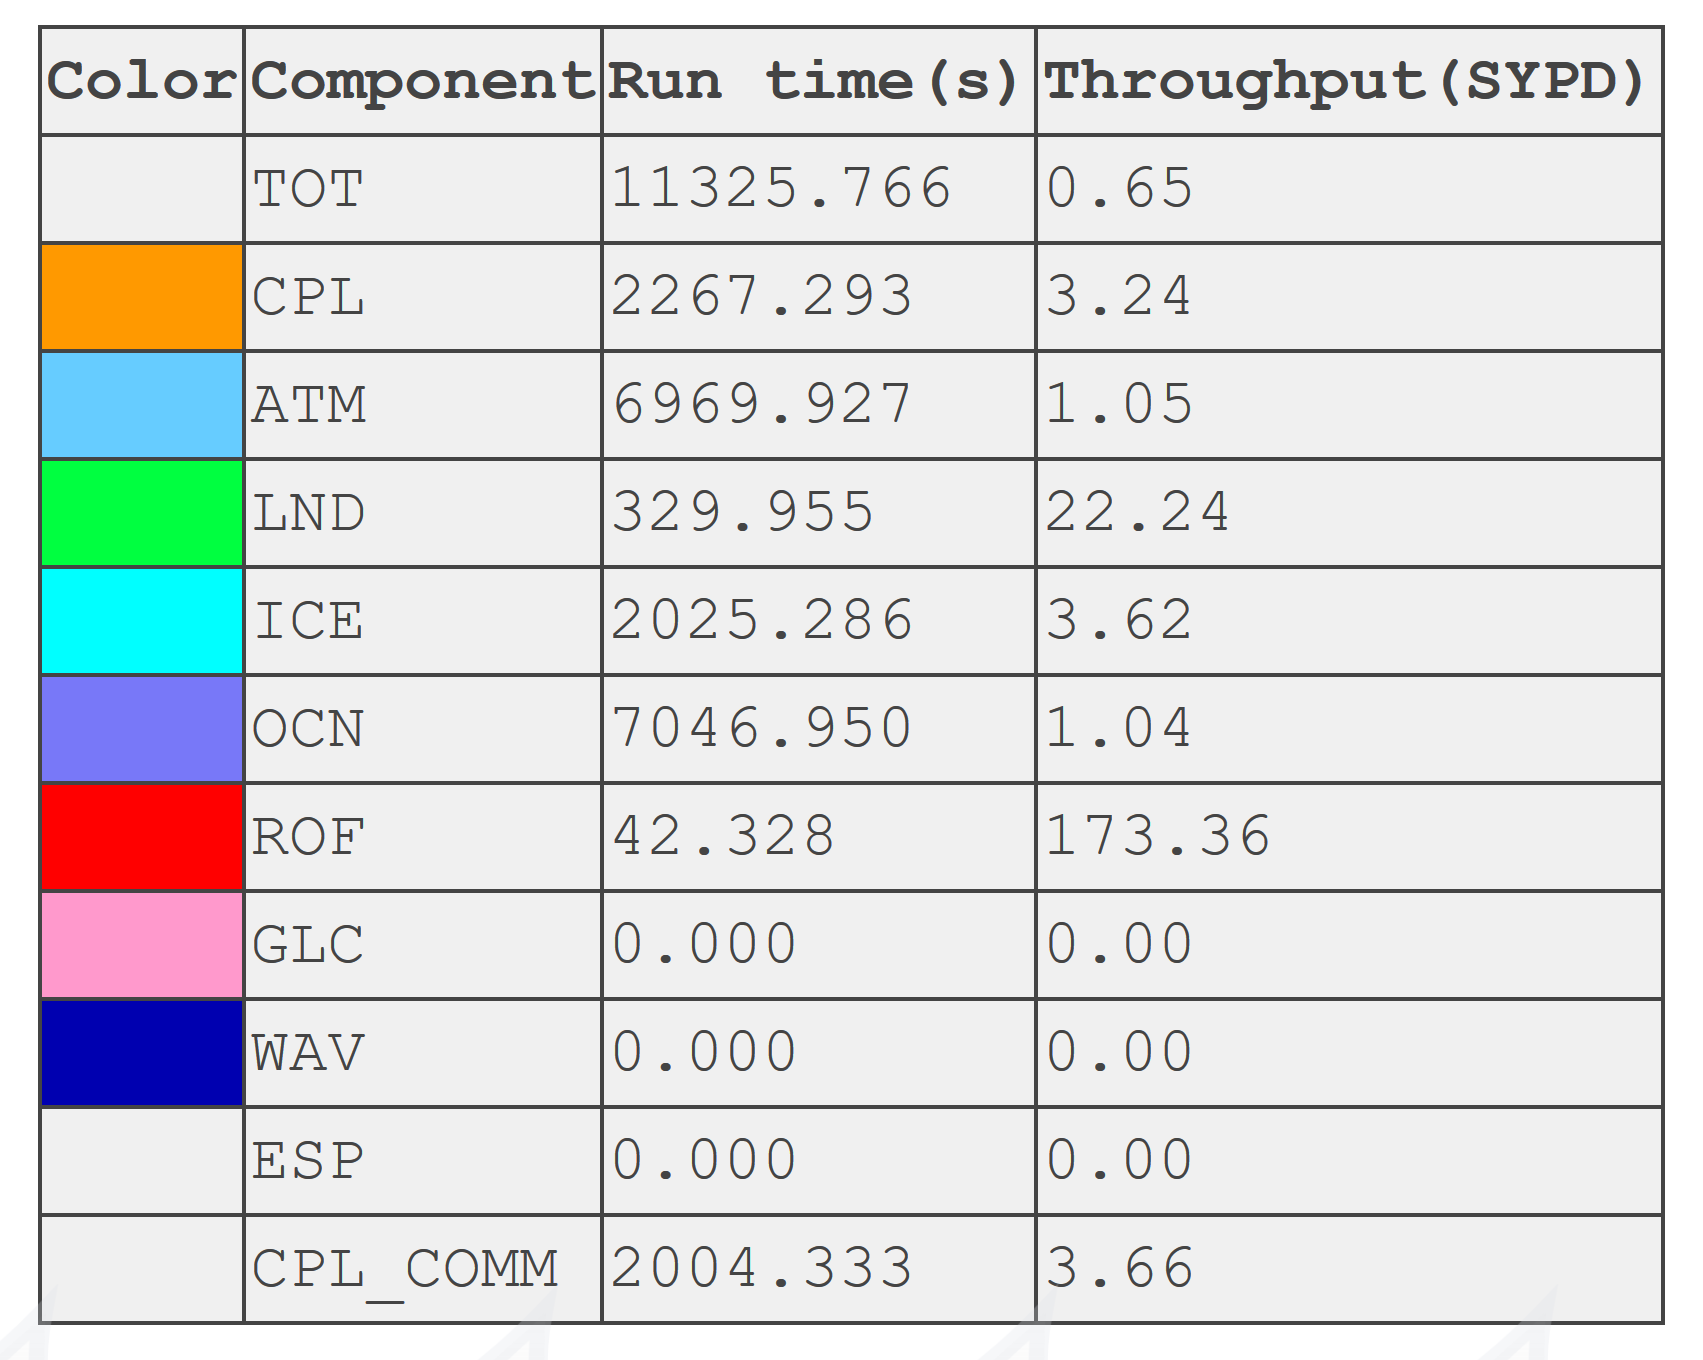
A tabular form details model run time and throughput per component.
The PACE portal provides a powerful search capability, including autocomplete, to select and deeply dive into experiments of interest. Users can search for experiments pertaining to a specific user or platform, or search for a specific model configuration (compset, grid, or case) or a combination thereof. The “search results overview” shows basic experiment metadata such as user, machine, case name etc. Upon selection of a desired experiment, the user is directed to the “experiment details view” that includes the model throughput and process layout for the various components (see figure above).
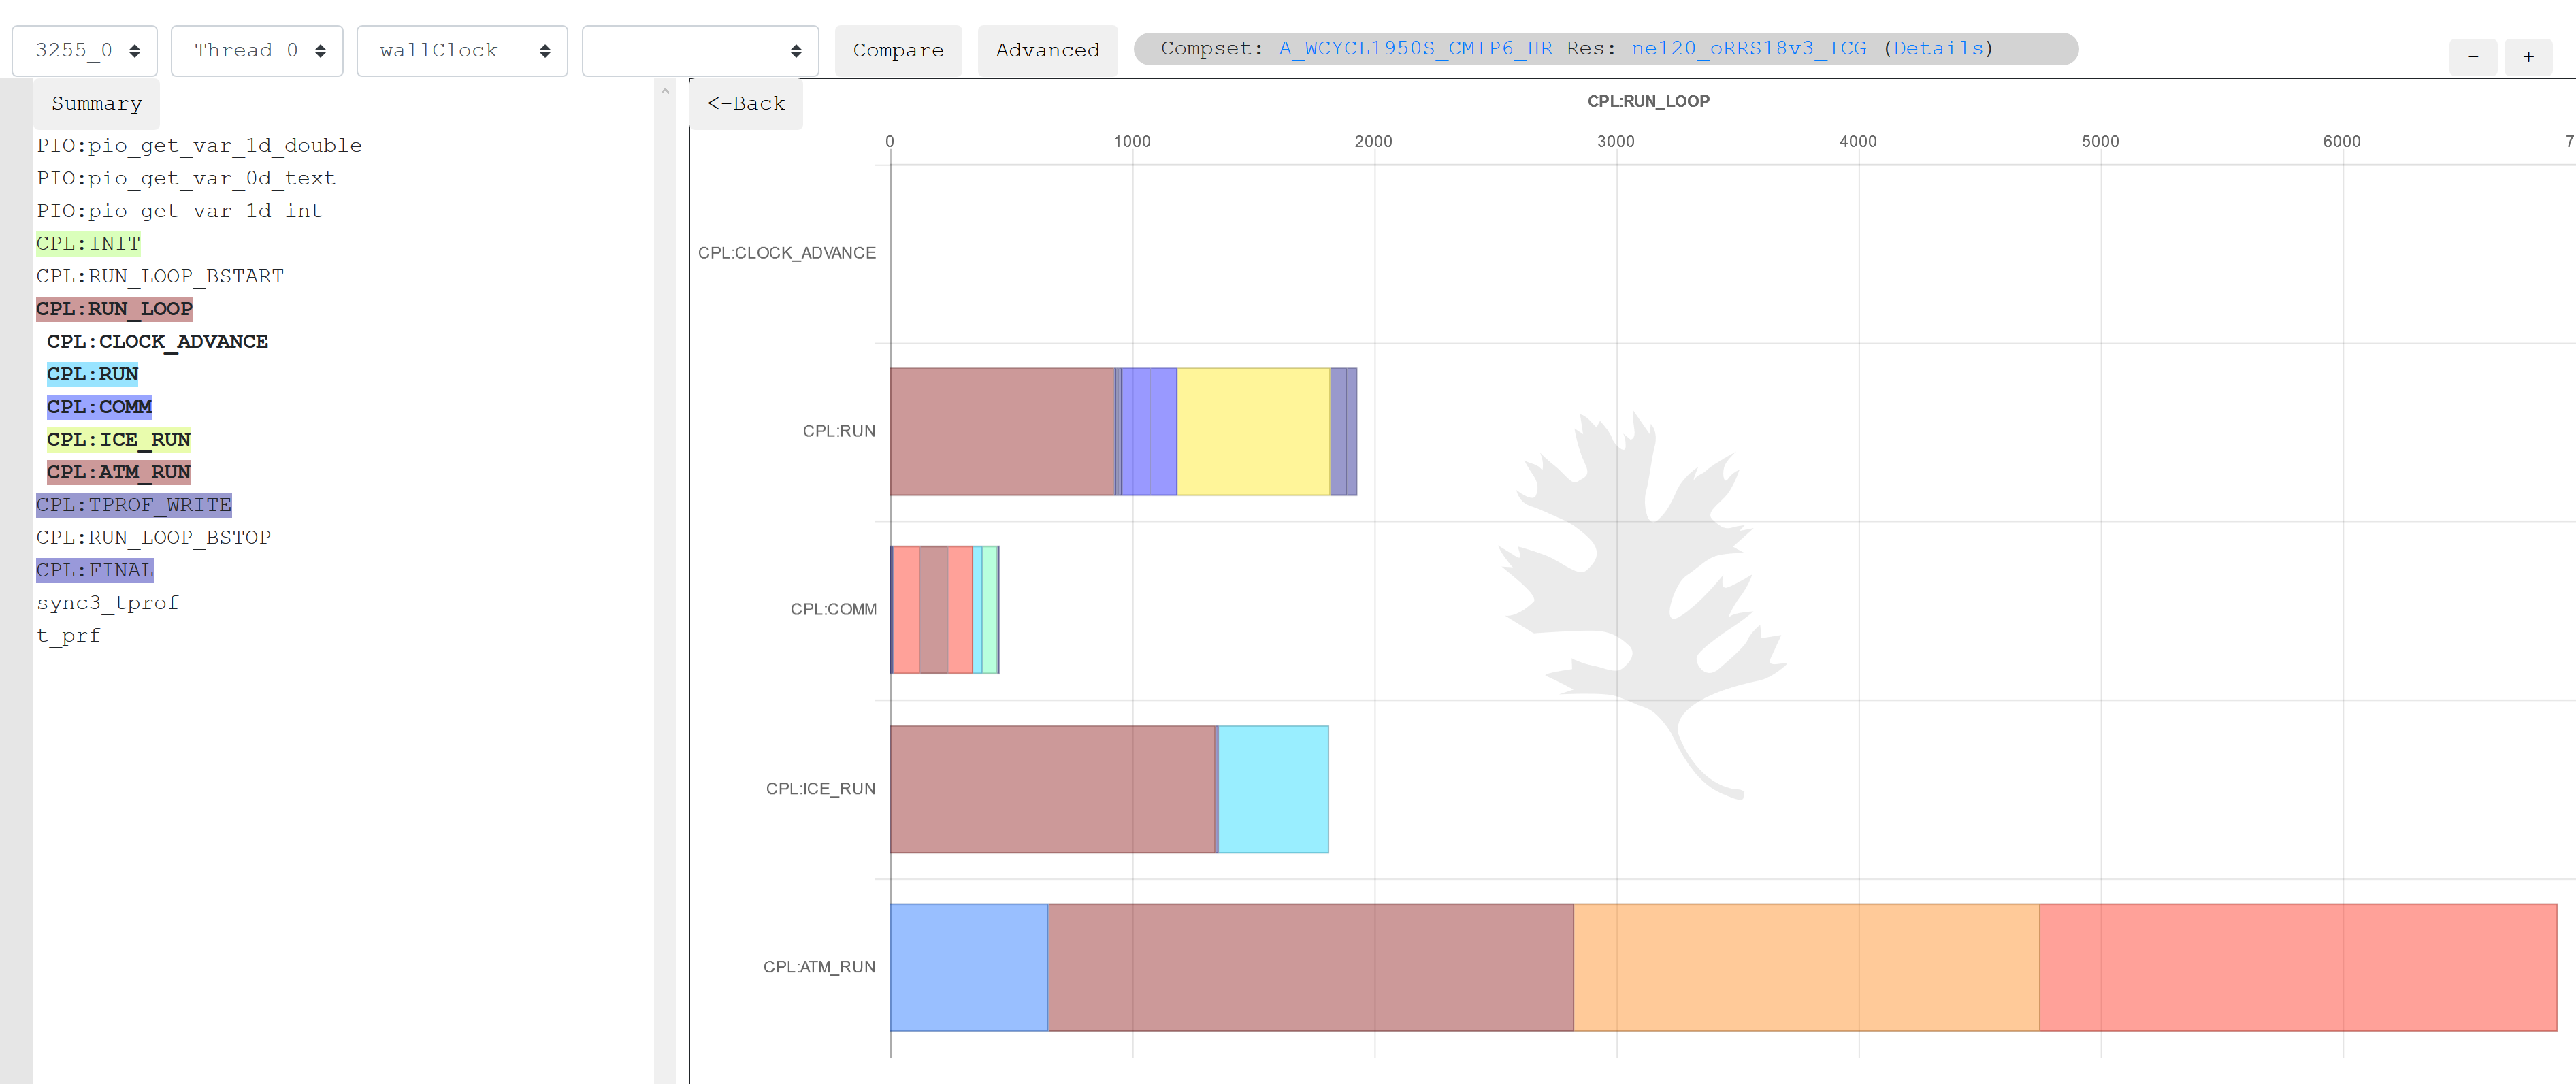
A tree graph view of application performance. Users can click on a specific application timer to dive deeper into the hierarchy to see the timing breakdown in sub-regions of interest.
A user can dive deeply into a particular task’s performance data through an interactive tree graph (see figure at left), which displays “application timers” that log how long certain code blocks took to run. Additionally, a user can select a parallel process or thread for a more detailed view aiding in comparisons across application regions.
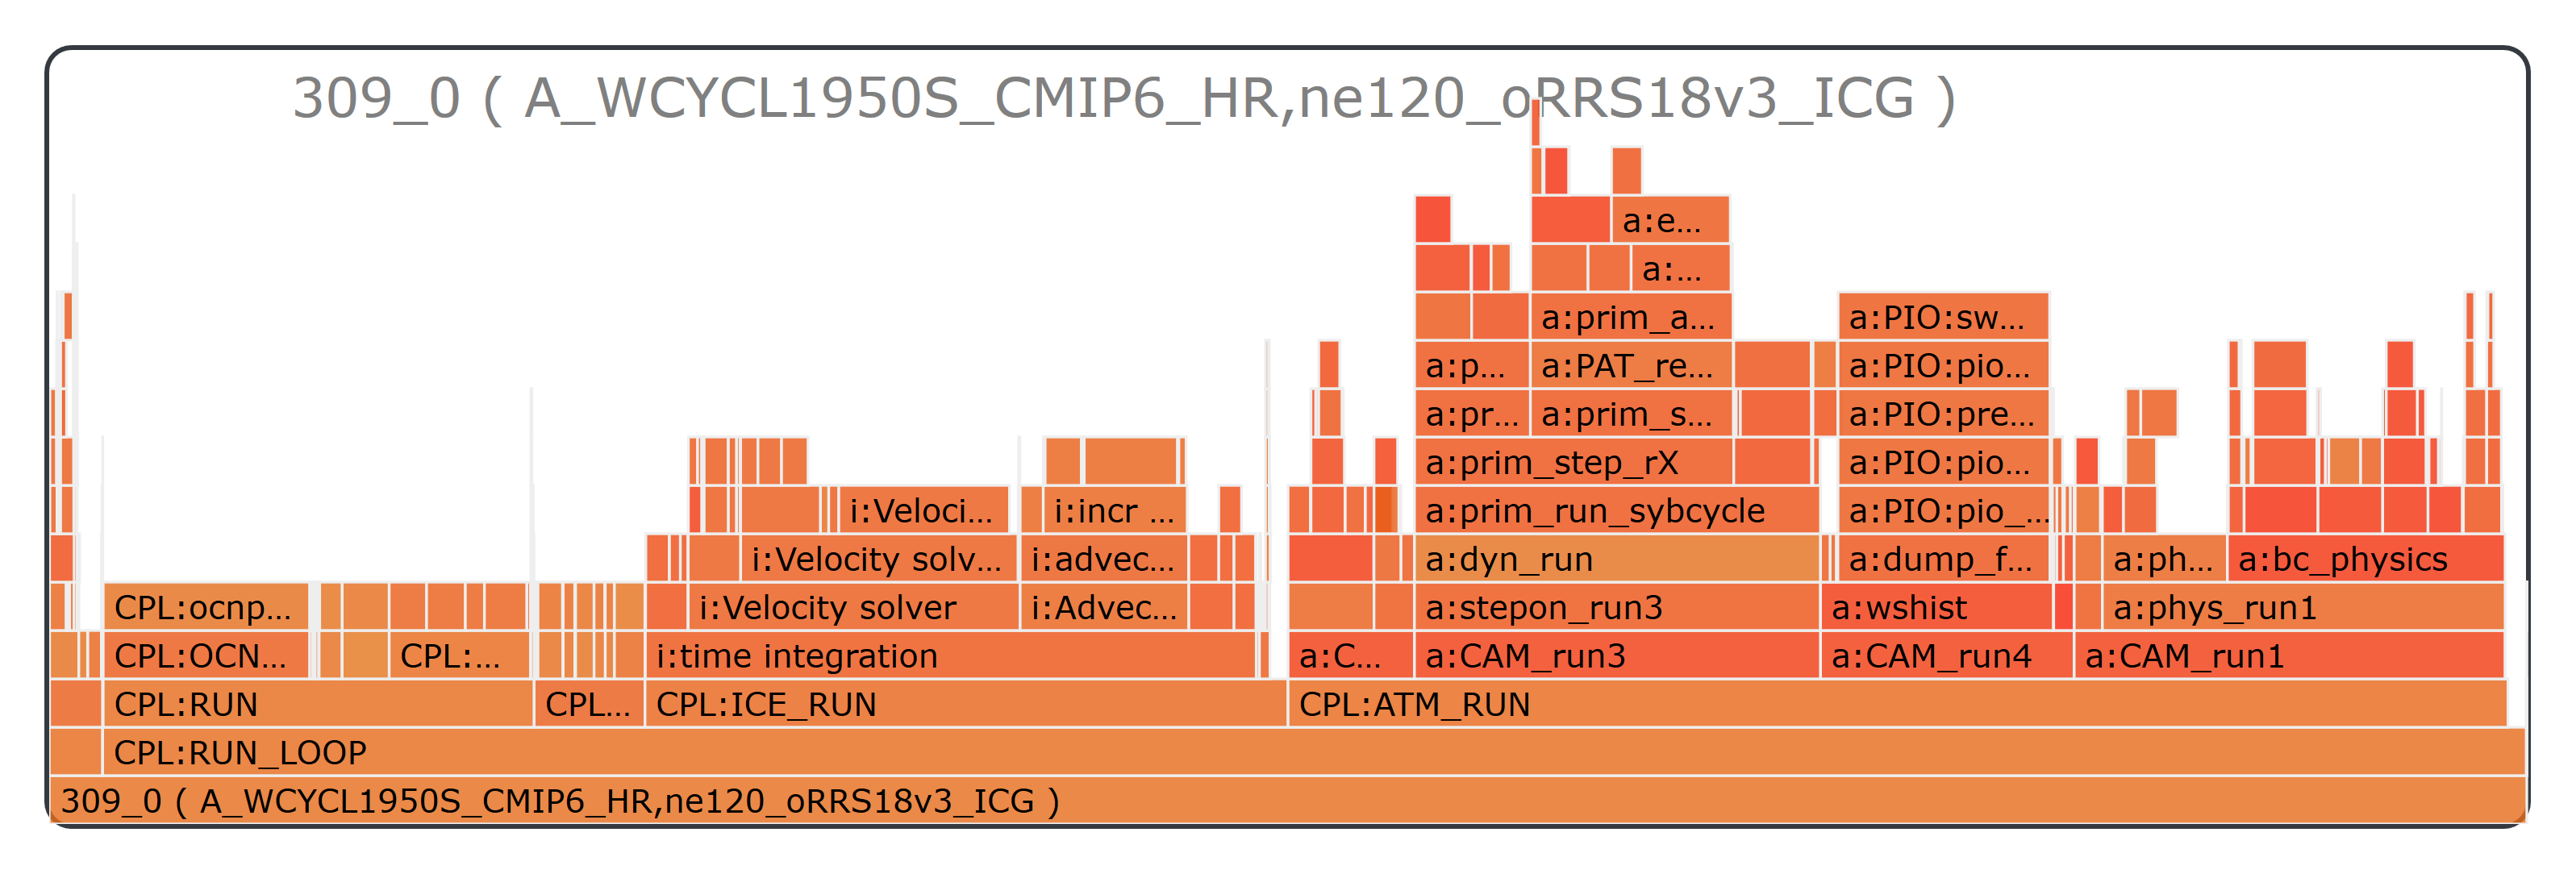
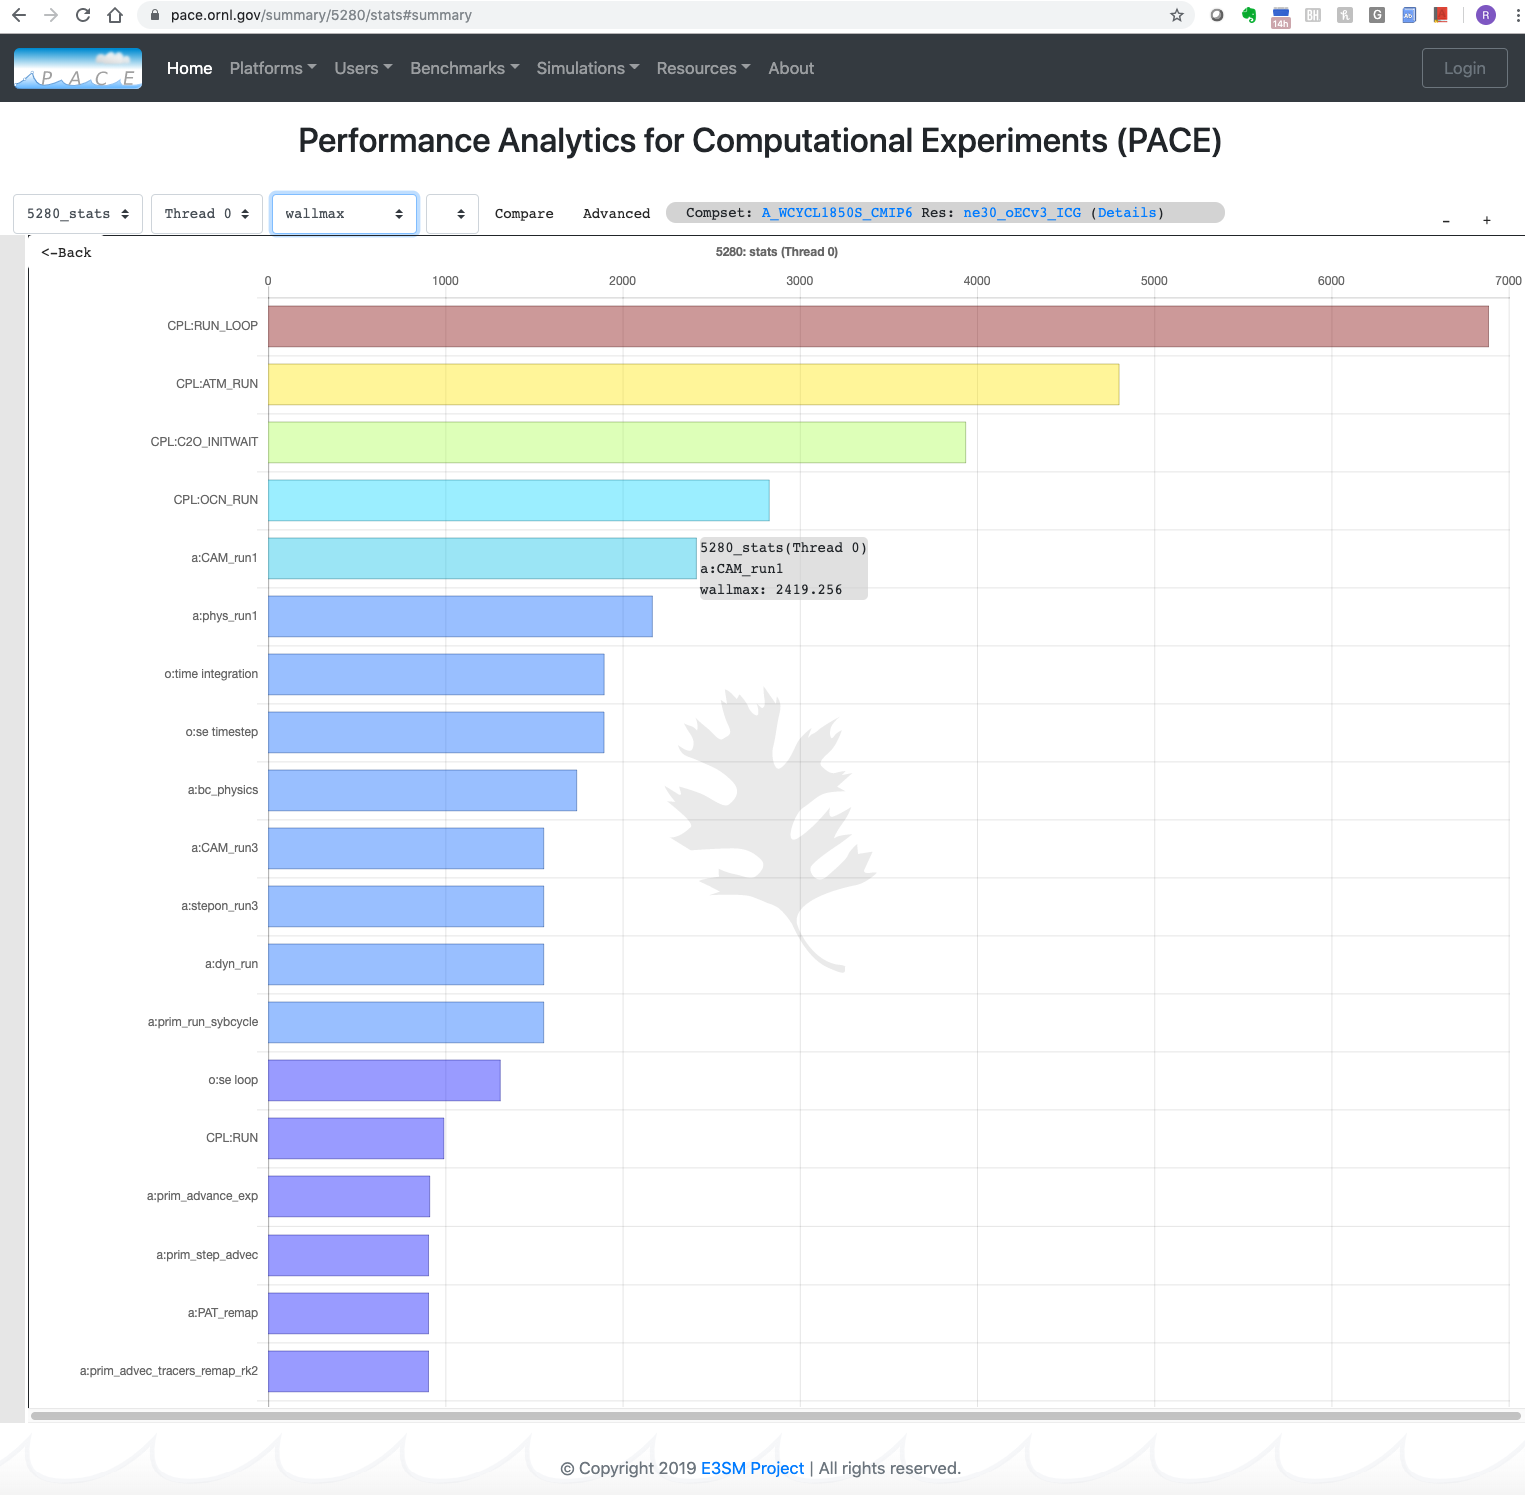
A flame graph concisely summarizes the time spent in various application regions.
The flame graph displayed above illustrates an alternate view of the data that highlights the time spent in different application regions.
PACE also enables performance comparisons across multiple experiments and parallel processes. An interested user can download an experiment’s provenance and raw performance data for further analysis. A detailed demonstration of the portal features is captured in the PACE Web Portal Features video.
PACE already contains data for more than 5000 experiments for users to explore and additional experiments are being added regularly.
References
- PACE portal: https://pace.ornl.gov/
- Videos:
Contact: Sarat Sreepathi, sarat@ornl.gov, https://sarats.com, Oak Ridge National Laboratory