E3SM Diagnostics Adds ENSO Analysis
The E3SM Diagnostics Package is an essential tool enabling comprehensive diagnostics and evaluation of the E3SM model against observations to facilitate the development of this next generation Earth system model. E3SM Diagnostics is embedded into the E3SM process flow to enable seamless transition between model runs and diagnostics.
E3SM Diagnostics is adding an important new capability: El Niño – Southern Oscillation (ENSO) related diagnostics. ENSO is the dominant mode of climate variability over seasonal to interannual time scales in the global climate system, so realistic simulation of ENSO variability is important for both climate prediction and projection. (For more information, see the “About ENSO and the Nino Regions“ below.) The new ENSO diagnostics will complement the existing diagnostics of zonal mean line plots, pressure-latitude zonal mean contour plots, pressure-longitude meridional mean contour plots, latitude-longitude contour maps, polar contour maps, area mean time series, and cloud top height-Tau joint histograms.

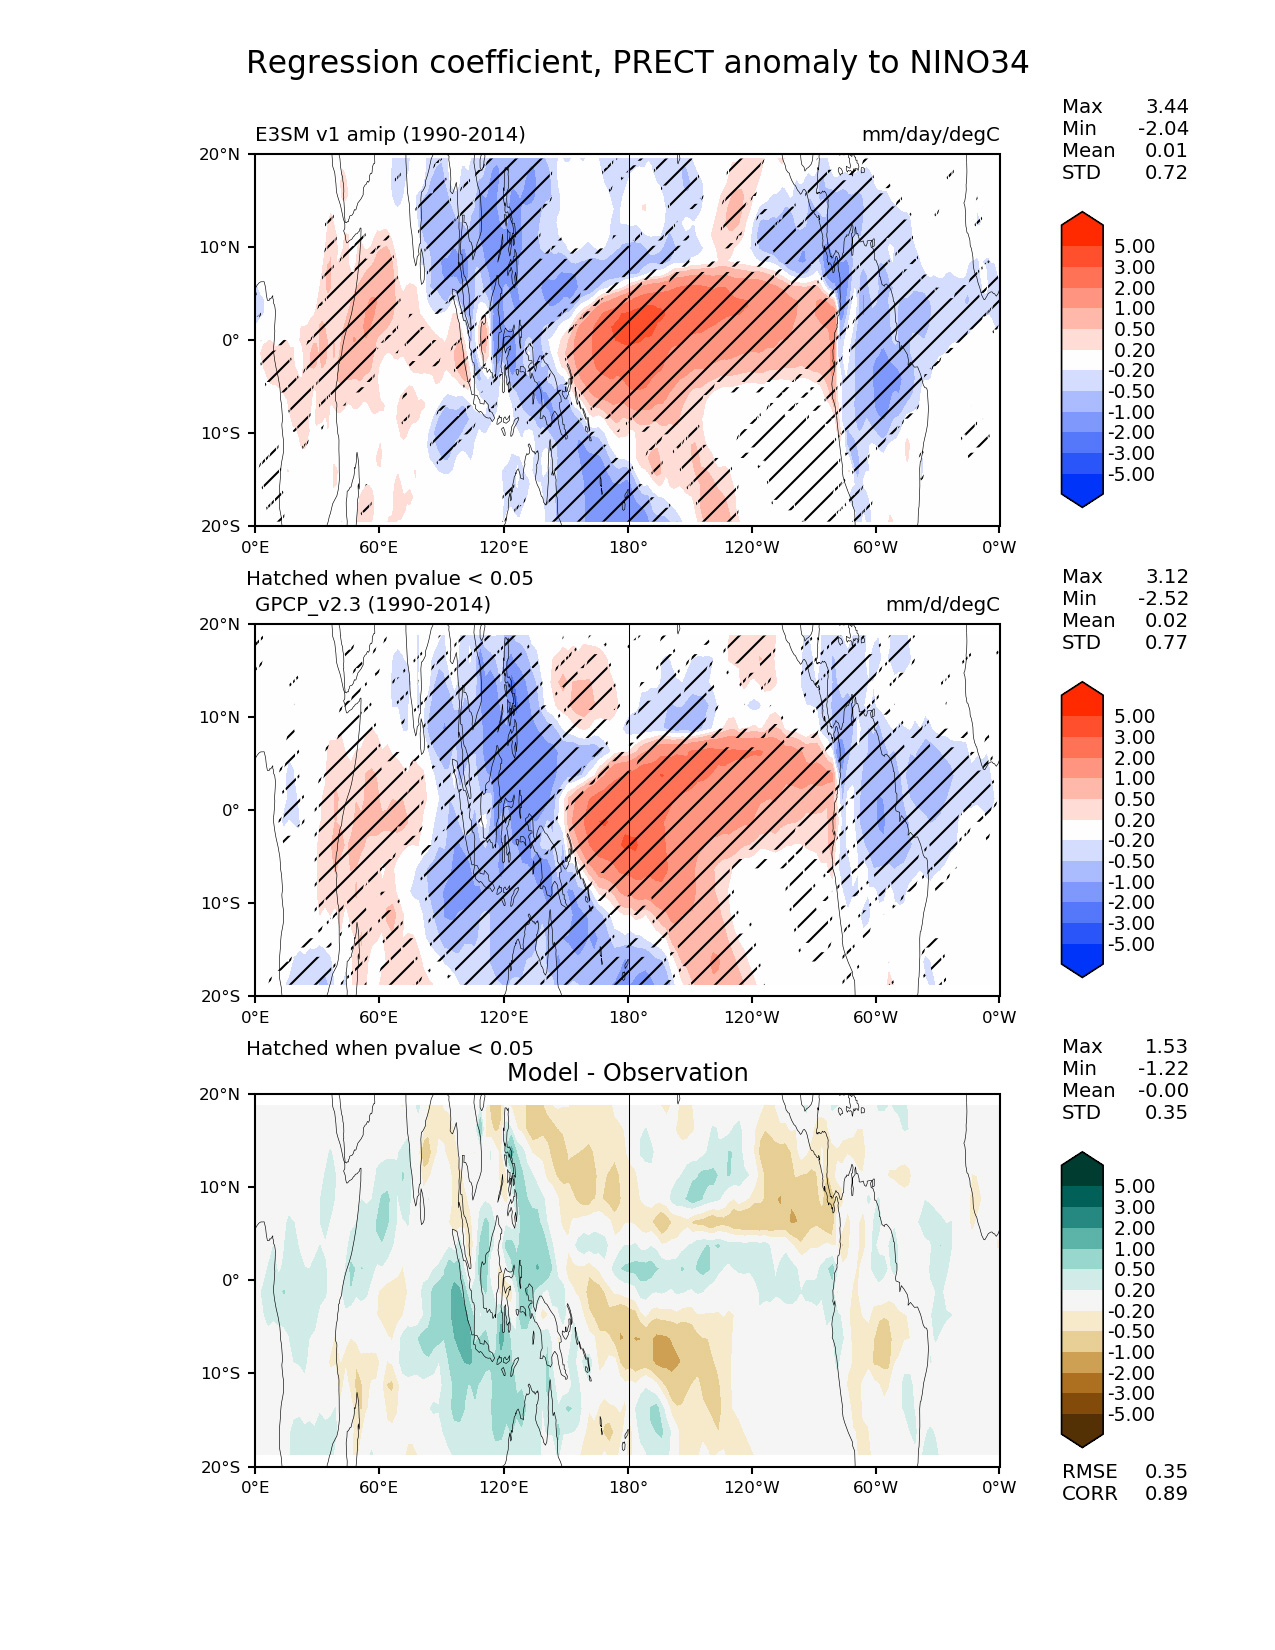
Plot of the linear regression coefficient of total precipitation rate on monthly Niño sea surface temperature (SST) anomalies. Top plot shows the E3SM standard resolution v1 model using monthly output for 1990-2014 from an AMIP run. The middle plot shows the same variable but uses precipitation rate from the satellite-based Global Precipitation Climatology Project (GPCP) v2.3 data for the same period (GPCP data provided by the National Oceanic and Atmospheric Administration (NOAA) Earth Systems Research Laboratory (ESRL) Physical Sciences Division (PSD), Boulder, Colorado, USA, from their website at https://www.esrl.noaa.gov/psd/). The bottom plot shows the difference between the model and the observations.
The ENSO diagnostics suite was first implemented in A-PRIME (Accelerated Priority Metrics). E3SM developers are incorporating this suite into E3SM Diagnostics with enhanced design and capabilities. The first component of this new diagnostic set is the regression of a variable over the Niño region SST anomalies (departures from the normal or average sea surface temperature conditions) as shown in the figure above. The plots show the linear regression coefficient of select atmospheric fields on monthly Niño SST anomalies in a user-defined subsection of the globe. This set of analyses is used to evaluate the response of the atmosphere to the SST anomalies, and therefore provides insights on model tuning for better ENSO representation in coupled simulations. (If the atmospheric model generates a reasonable response compared to the observed SST data, then the model is likely to generate a better ENSO signal in coupled runs.) Hatching in the top two plots is used to indicate a confidence level in the regression greater than 95%. As with the latitude-longitude and polar images, there are three plots: model, observations, and the difference between the two. For each plot, E3SM Diagnostics displays the following statistics: max, min, mean, and standard deviation. For the difference plot, the package also provides the root mean square error (RMSE) and the correlation coefficient.
E3SM Diagnostics also allows model to model and observation to observation comparisons. Supported variables include precipitation rate, surface stresses, surface net flux and heat fluxes. Model to model comparisons also support total, low, middle, and high cloud fraction. Users can select the Niño region to use – Niño 3, Niño 4, and Niño 3.4 (the default). (For an explanation of the different region numbers, see the “About ENSO and the Niño Regions” section below.) When sea surface temperature data is unavailable, the Niño index time series calculated from HadISST1 is used. Users can also select the target region; 20 south to 20 north is the default.
Developers will be adding more components to this diagnostic set.
About E3SM Diagnostics
A modern, Python-based diagnostics package for evaluating Earth system models, E3SM Diagnostics is modeled after the National Center for Atmospheric Research’s (NCAR’s) atmosphere diagnostics package. E3SM Diagnostics is flexible enough to allow for the addition of new observational datasets and new diagnostic algorithms. Additional features include modifiable figures; straightforward installation, configuration and execution; and multiprocessing for fast computation. Package developers maintain an updated observational data repository and add the most recent datasets to the repository as they become available. As a community tool, E3SM Diagnostics can run on any Coupled Model Intercomparison Project (CMIP)-compliant model output, not just E3SM.
About ENSO and the Niño Regions
The El Niño – Southern Oscillation occurs in the central and eastern tropical Pacific Ocean and is marked by warmer (El Niño) or cooler (La Niña) sea surface temperatures (SST) and the corresponding changes in winds and tropical rainfall. El Niño or La Niña generally occurs every two to seven years and can cause the tropical Pacific Ocean to warm or cool by as much as 1℃ to 3℃. For more information and to more clearly visualize the El Niño and La Niña conditions, see the Met Office’s video titled “El Niño – What is it?”.

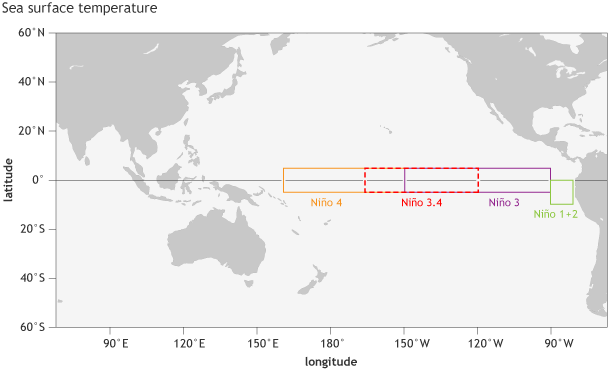
Location of the Niño regions for measuring sea surface temperature in the eastern and central tropical Pacific Ocean. NOAA Climate.gov image by Fiona Martin from the blog post “Why are there so many ENSO indexes, instead of just one?” by Anthony Barnston.
The different Niño region numbers (Niño 3, Niño 4, and Niño 3.4) refer to regions of the equatorial Pacific Ocean which correspond to the numerical labels that were assigned to ship tracks that crossed these regions historically. See the “Sea surface temperature indexes” section of the Climate.gov’s “Why are there so many ENSO indexes, instead of just one?” webpage and the Climate Data Guide’s “Nino SST Indices” page for more information.
For more information, visit the following pages:
Previous news: https://e3sm.org/e3sm-diagnostics-v1-5-0/
Web page: https://e3sm.org/resources/tools/diagnostic-tools/e3sm-diagnostics/
Full documentation: https://e3sm-project.github.io/e3sm_diags/docs/html/index.html
Online tutorial: https://e3sm.org/about/events/e3sm-tutorials/
GitHub repository: https://github.com/E3SM-Project/E3SM_diags
Jupyter Notebooks with climatology files as inputs:
Contacts: Ryan Forsyth, Jill (Chengzhu) Zhang, and Chris Golaz, Lawrence Livermore National Laboratory


