

Introducing Zppy
What is zppy?
zppy (pronounced “zip-ee”) is a post-processing toolchain for E3SM written in Python. The goal of zppy is to speed up the post-processing of E3SM simulations by automating commonly-performed tasks. It could serve as a standard tool for all E3SM simulation campaigns, providing consistent post-processing, results curation, and simulation documentation. zppy v1.0.0 is included in E3SM Unified 1.5.0, both of which were released in July 2021.
zppy is run with the simple command zppy -c <configuration_file>. The configuration file specifies input and output directories, as well as the individual task configurations
Supported tasks include generating climatology files and time series files (using ncclimo, NCO), E3SM Diagnostics plots, MPAS-Analysis plots, and global time series plots. Additionally, these tasks can include subtasks — for example, users can run both monthly and daily time series for both atmosphere and land.
To avoid unnecessary duplication, settings in zppy configuration files can be inherited. Settings can be defined at the top level, task level, or subtask level. Users can then define parameters at the top level of the configuration file while providing more specific parameters (or overriding parameters) for individual tasks and subtasks. Sensible default values are provided for many parameters.
zppy launches batch jobs for each task, or if multiple year-sets are defined (e.g., 1-50, 50-100, etc.), then a single task may launch multiple jobs, one for each year-set. Each job comes with a batch-job file, log file, and status file. Users can check the current status by inspecting the status file (possible statuses include WAITING, RUNNING, OK, or ERROR). In case of errors, the batch-job and log files provide additional information. If the web server path is specified, zppy will move the plots onto the web server for viewing.
zppy submits the batch jobs for execution by SLURM. zppy handles dependencies between tasks and passes them to SLURM. Internally, each batch job is created by instantiating Jinja2 template scripts (usually written in bash, but other languages are supported as well).
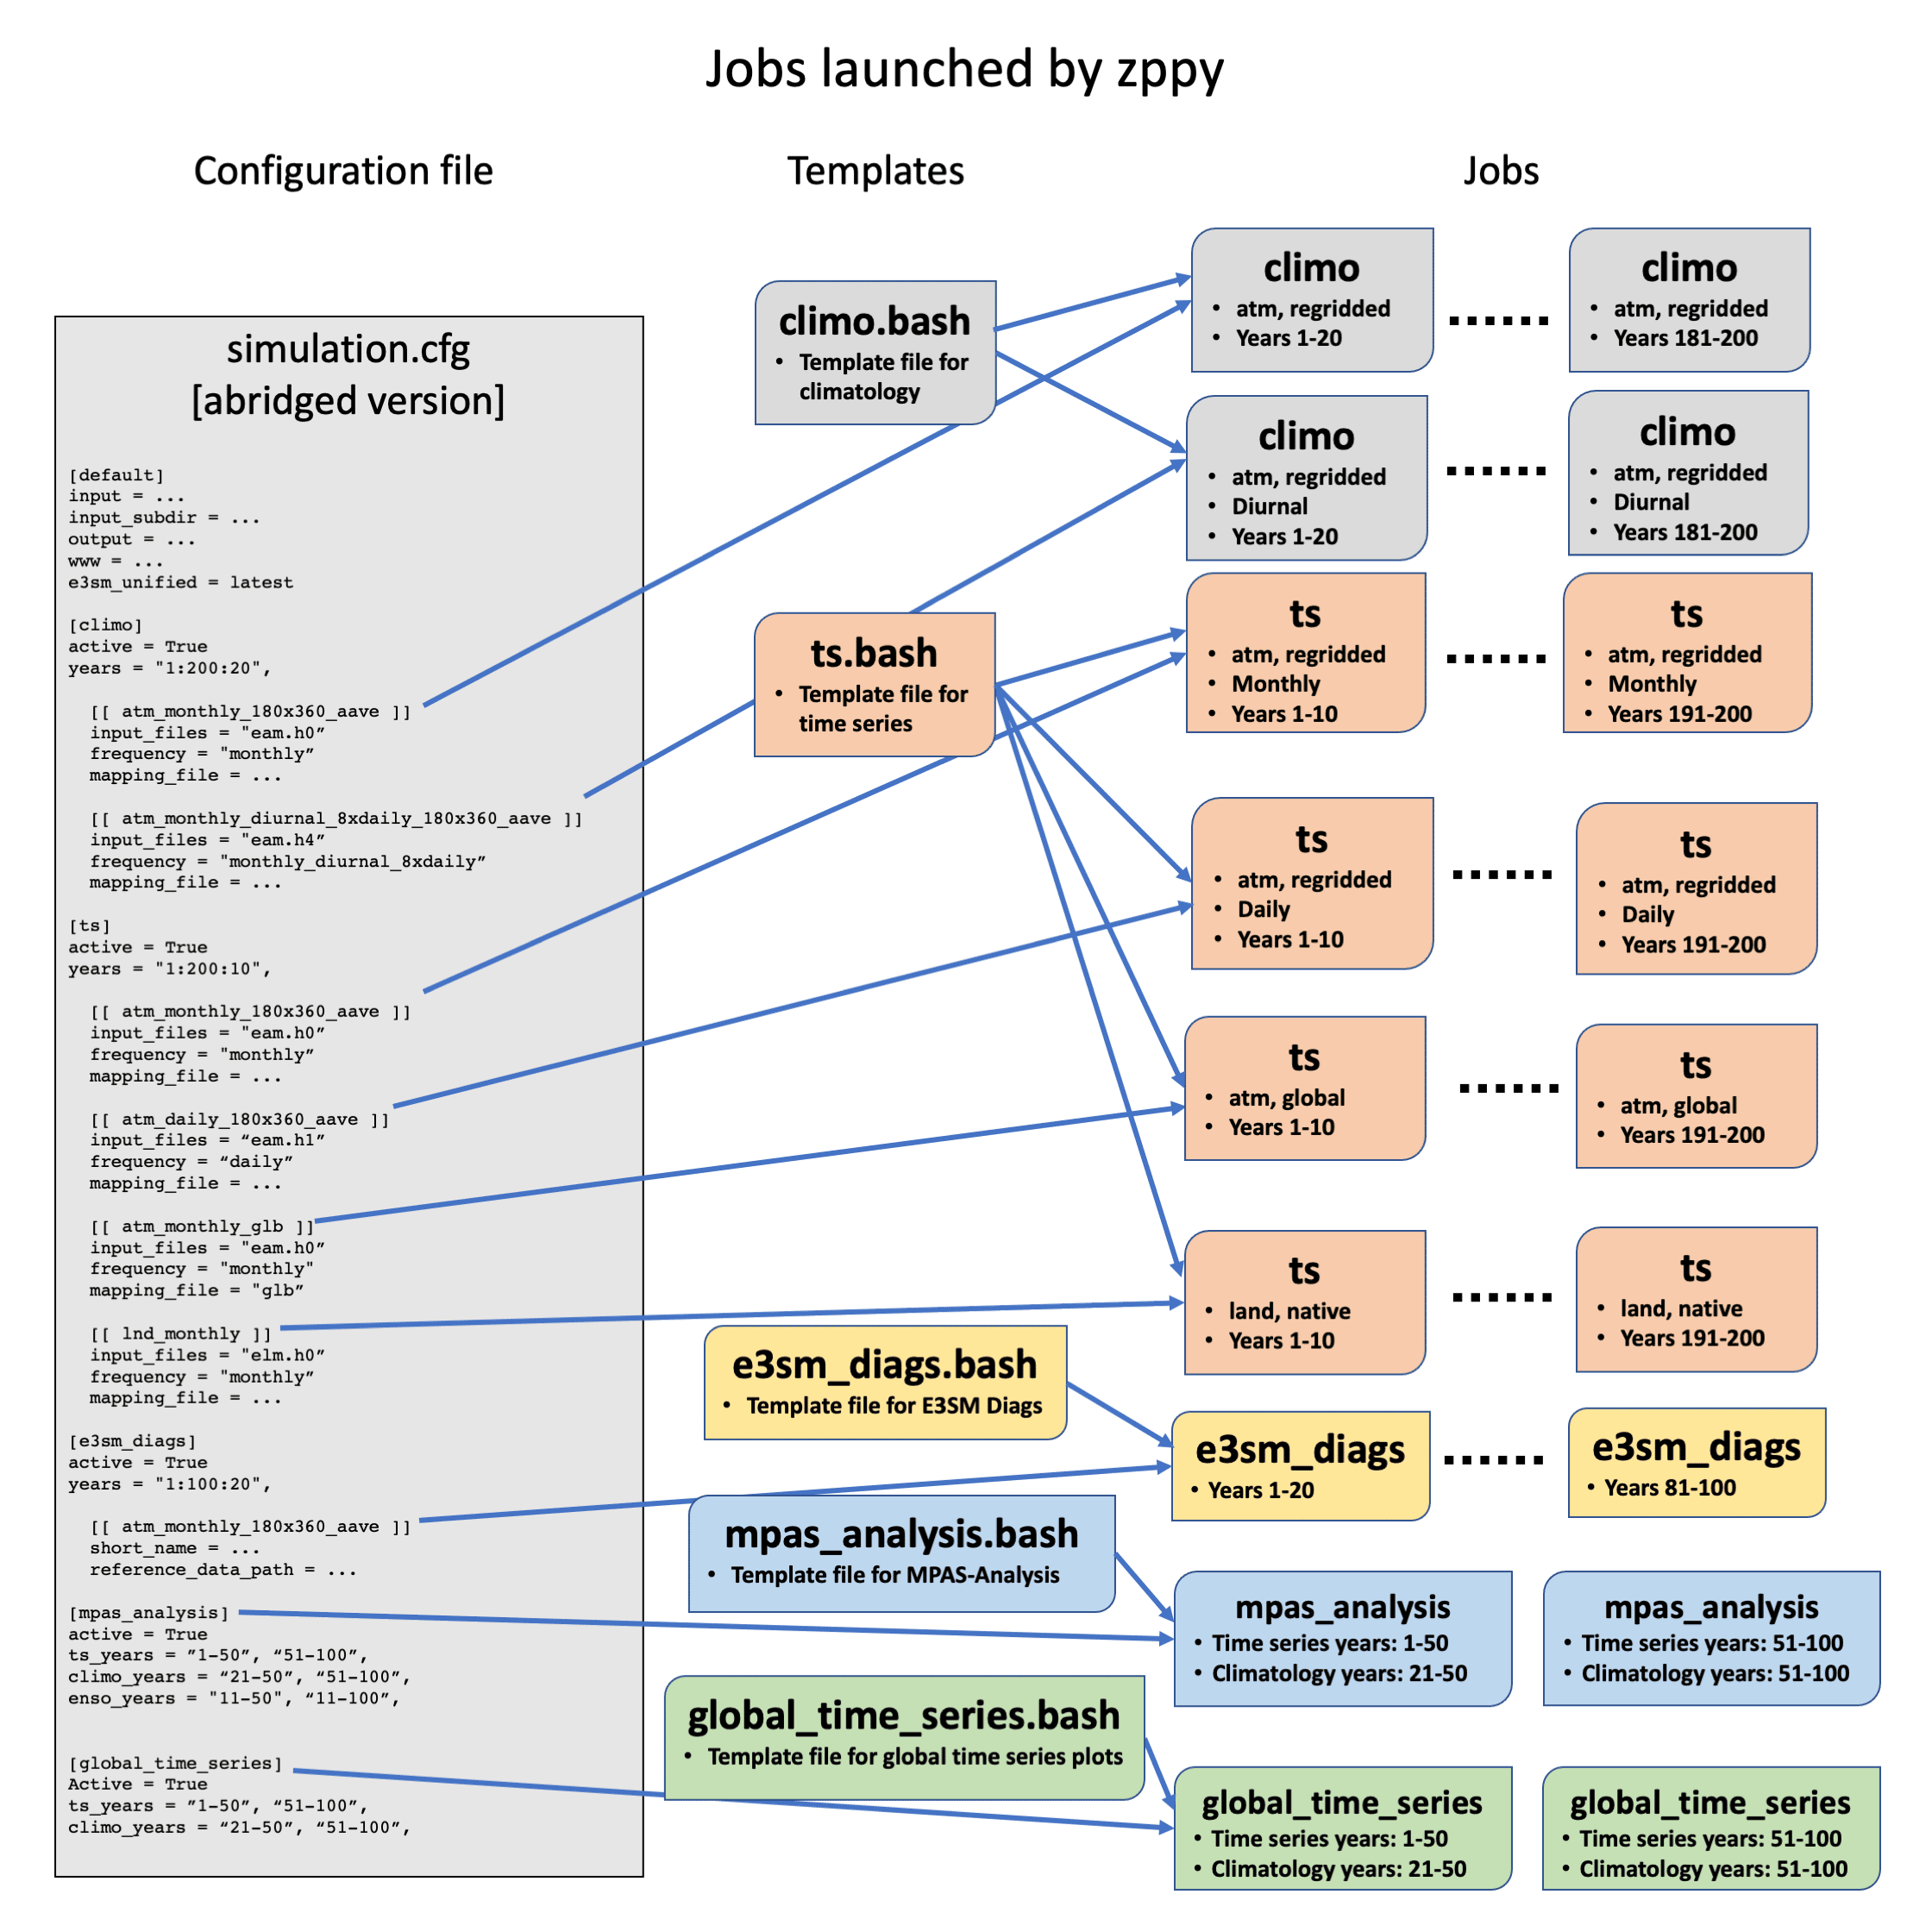
Figure 1. Illustration of how zppy uses sections of the configuration file and bash/Jinja2 templates to launch various jobs. climo stands for climatology and ts stands for time series. Note that the configuration file is abridged – see the zppy tutorial for more complete examples.
Example
For this example, assume a researcher has 200 years of simulation data. Figure 1 displays some of the tasks they might configure zppy to run:
- 20-year atmosphere monthly and seasonal climatologies, optionally regridded
- 20-year atmosphere monthly and seasonal climatologies resolving the diurnal cycle (eight times per day in this example, meaning eight data points per day with each point representing a three-hour time block of monthly or seasonally averaged values), optionally regridded
- 10-year atmosphere monthly time-series, optionally regridded
- 10-year atmosphere daily time-series, optionally regridded
- 10-year atmosphere monthly time-series, globally averaged
- 10-year land monthly time-series, optionally regridded
The scientist can also configure zppy to generate helpful plots such as:
- E3SM Diags for 20-year periods, (E3SM Diags includes many diagnostic sets – this example assumes the researcher would like to run them all)
- MPAS-Analysis for 50-year periods
- Global time series plots for 50-year periods
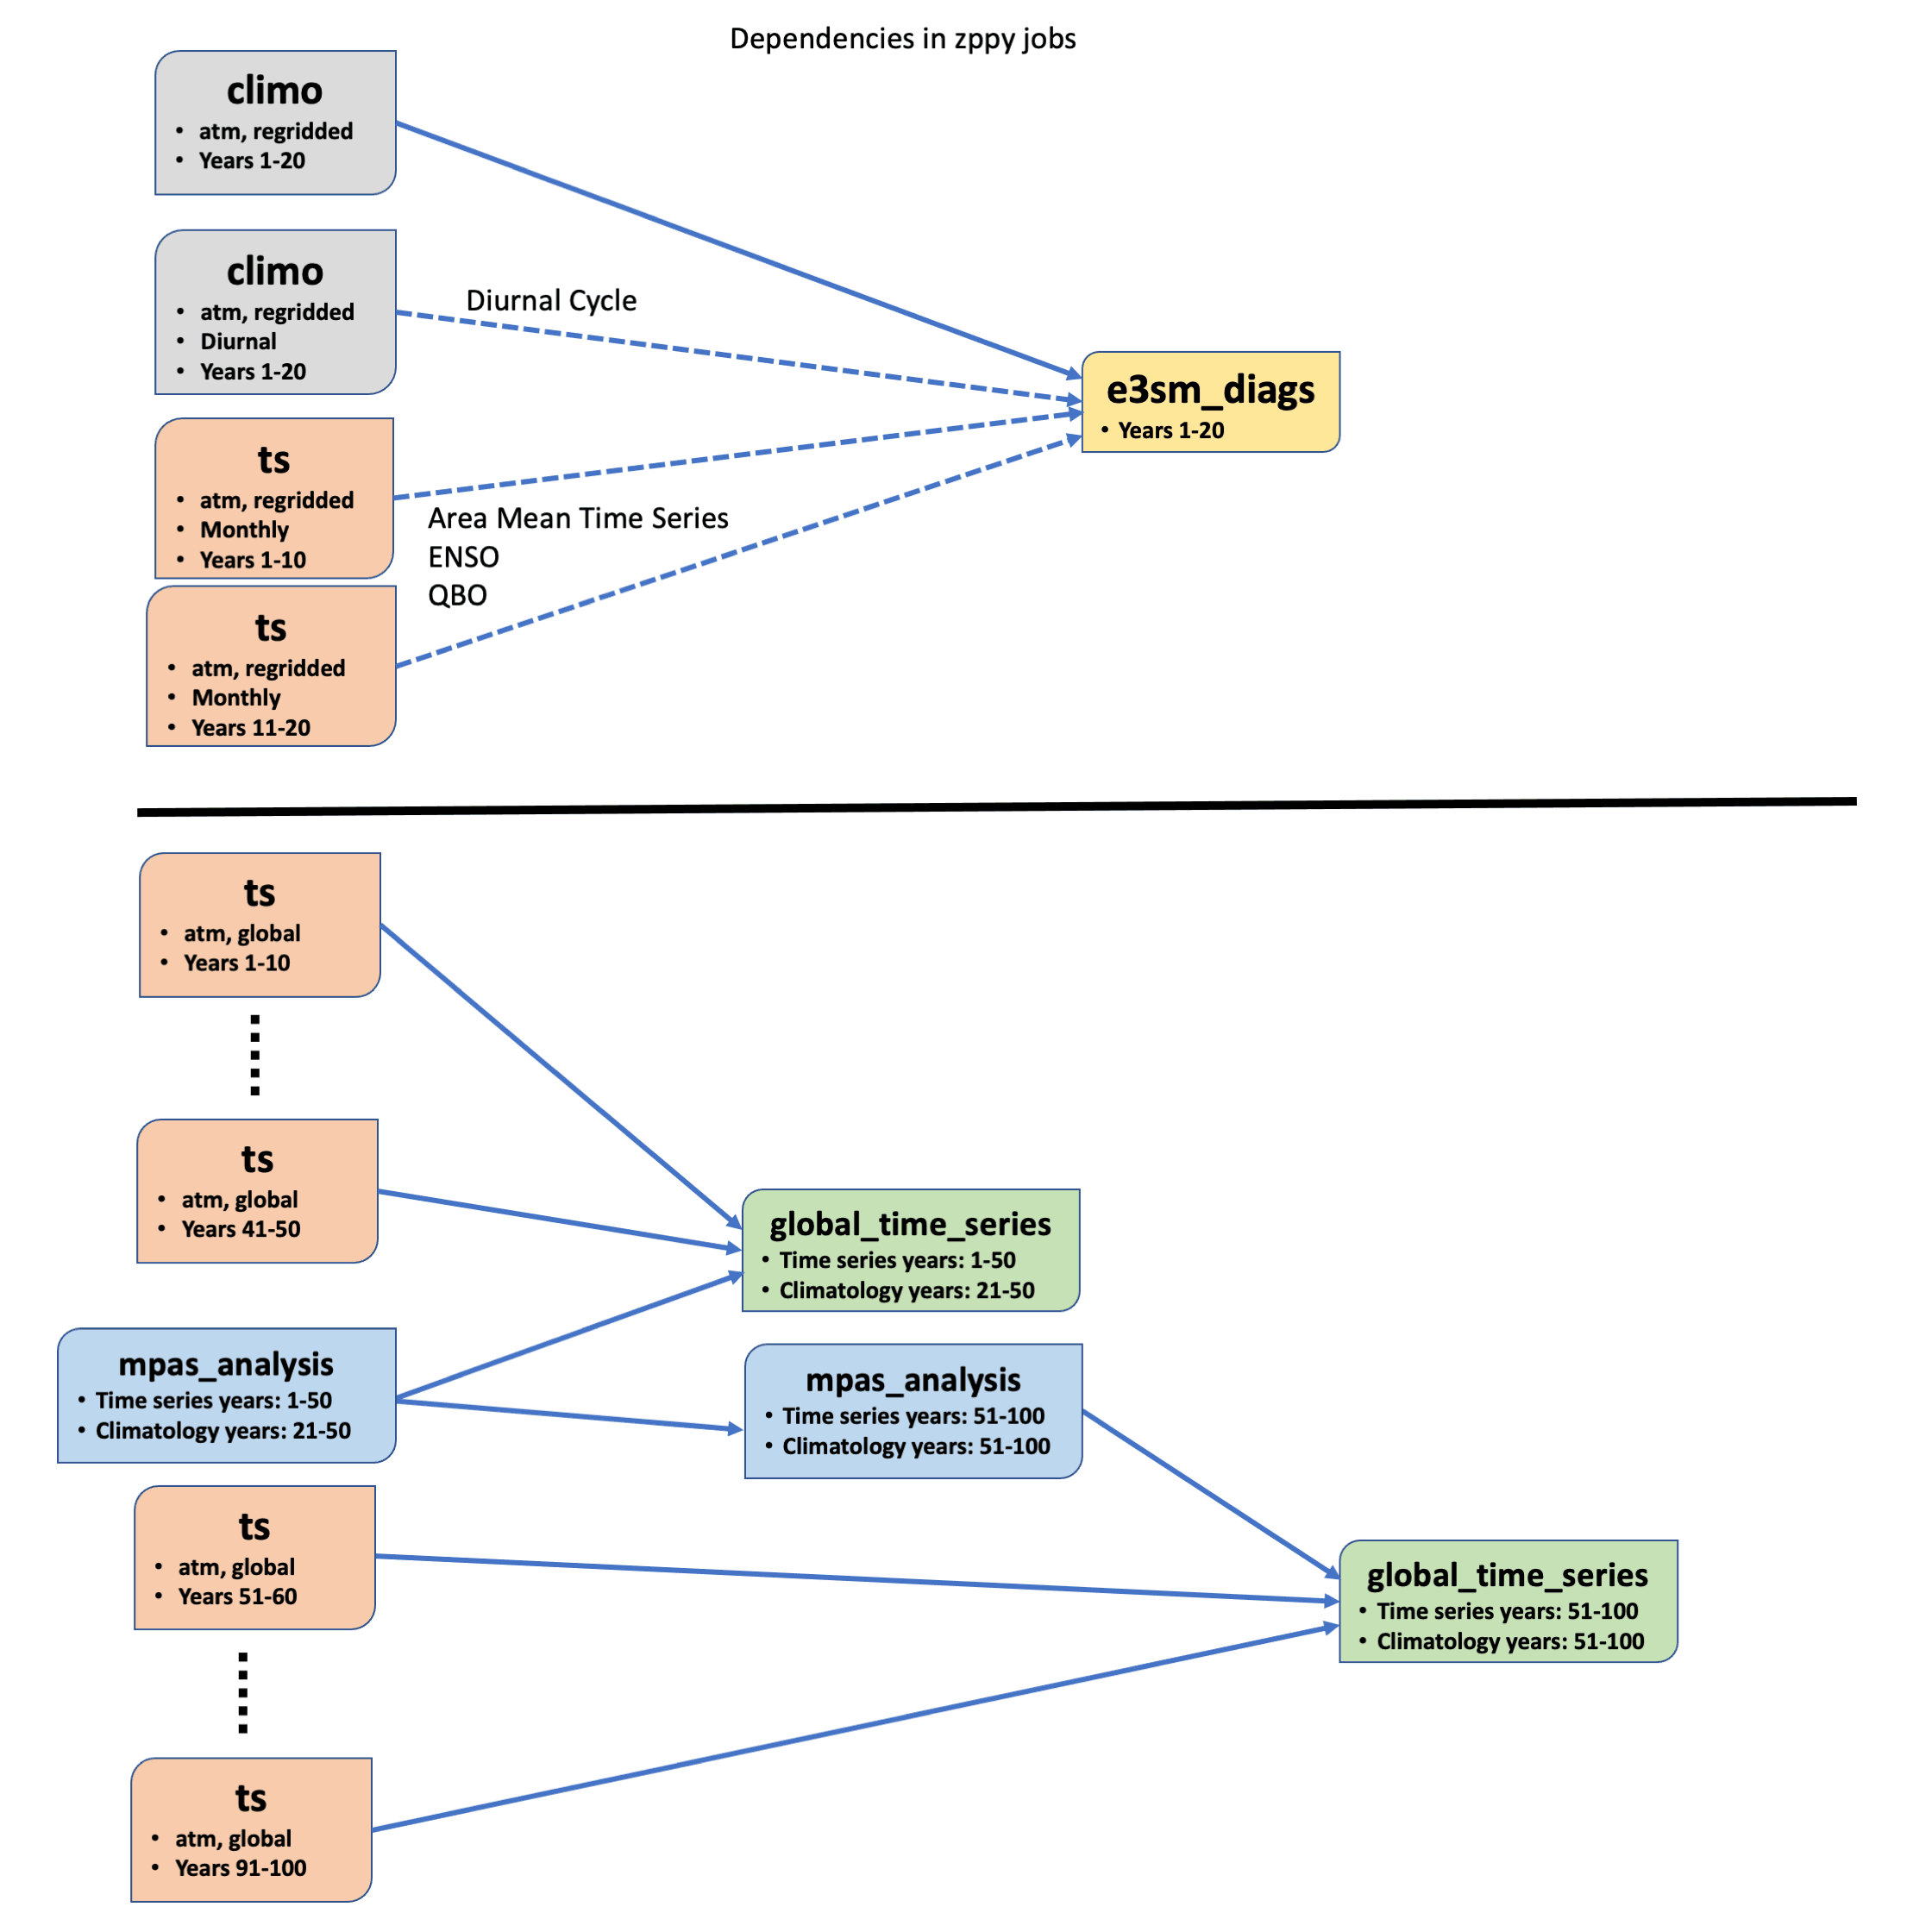
Figure 2. Two possible job dependency graphs. climo stands for climatology and ts stands for time series.
The figures illustrate schematically how zppy would function in this example. Figure 1 shows how zppy uses sections of the configuration file and bash/Jinja2 templates to launch jobs. Figure 2 shows two possible job dependency graphs.
The top graph in Figure 2 shows the dependencies for the years 1-20 E3SM Diags task. This task requires the monthly climatology for years 1-20. Because the researcher wants to run the diurnal cycle diagnostic set, the diurnal climatology for years 1-20 is also required. Since the scientist wants to run the area mean time series, ENSO, and QBO diagnostic sets, the monthly time-series for years 1-10 and years 11-20 are required.
The bottom graph in Figure 2 shows the dependencies for the global time series plots. The plots for years 1-50 require the monthly time-series for years 1-10, 11-20, 21-30, 31-40, and 41-50 in addition to MPAS-Analysis for years 1-50. The plots for years 51-100 have similar requirements – however, the graph calls attention to the fact that MPAS-Analysis for years 51-100 itself depends on MPAS-Analysis for years 1-50.
Resources
For more information, visit the following pages:
- Web page:
- Documentation:
- GitHub repository:
- Installation:
- Tutorial:
- See also:
- “Running and Analyzing E3SM: Water Cycle Group’s Approach”, by Ryan Forsyth and Chris Golaz (PDF, YouTube video)