

Water Cycle in E3SMv1 High Resolution Model
Key Points
- The water cycle slows down (decreased fluxes) when grid spacing has a four times refinement
- High Resolution (HR) generally improves evapotranspiration, but precipitation and other terms (moisture convergence, terrestrial water storage, and runoff) have mixed results
- HR improves precipitation extremes, storm event precipitation contributions, and mountain snowpack
Background
The standard E3SMv1.0 model runs with 110 km atmosphere and land, 30-60 km ocean and sea-ice, and 0.5 degree river grids. In addition, a high resolution version was run with 25 km atmosphere and land, 8-16 km ocean and sea-ice, and 0.125 degree river grids. The high resolution version of E3SMv1 was designed to improve resolution of storm systems critical to addressing DOE mission needs and also served as a contribution to the HighResMIP (Haarsma et al. 2016) effort. The transient high resolution (HR) simulation was compared against a similarly configured simulation using the standard or low resolution (LR) grids to test the impact of grid spacing on the simulated water cycle. Analysis is carried out at the watershed scale over the conterminous United States (CONUS).
Mean Water Cycle Response to Resolution
Each term in the water cycle budget (precipitation, evapotranspiration, moisture convergence, terrestrial water storage, and runoff) is computed for each HUC2 (Hydrologic Unit Code level 2) watershed (Fig. 1) and for each month of the year to examine both the spatial and seasonal structure of the water cycle response to resolution.
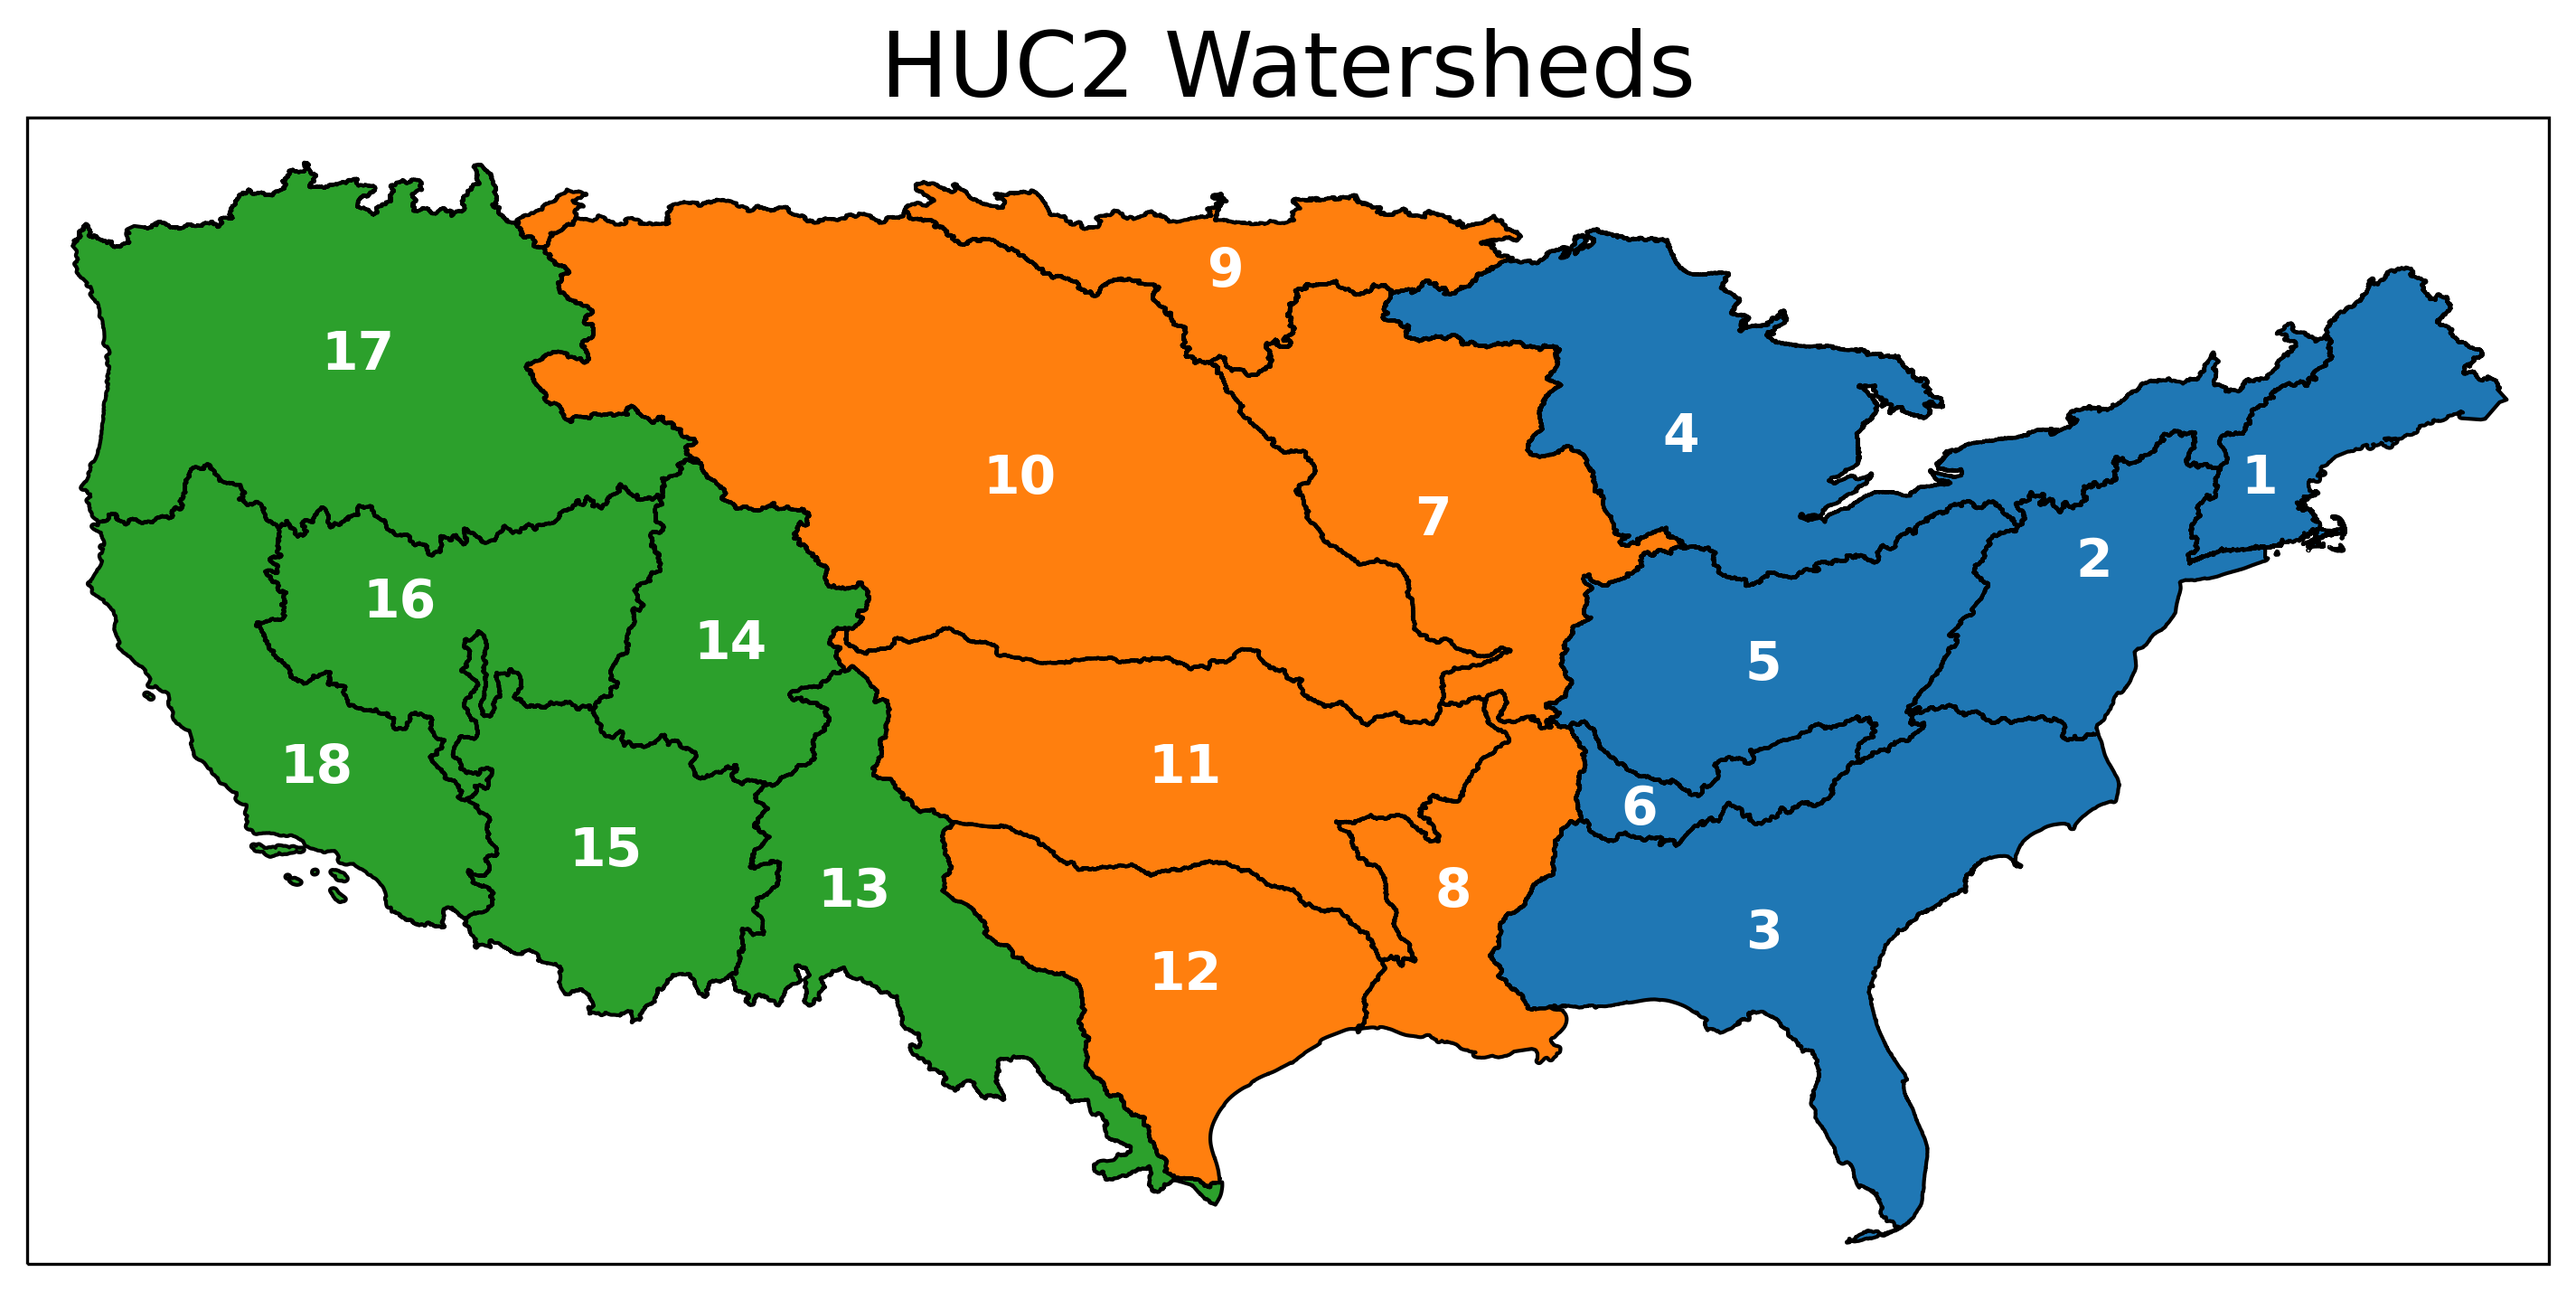
Figure 1: Hydrologic Unit Codes watershed map. We refer to watersheds 1–6 (in blue) as the Eastern conterminous United States (CONUS), watersheds 7–12 (in orange) as the Central CONUS, and watersheds 13–18 (in green) as the Western CONUS.
The seasonal and watershed scale precipitation response is summarized in a stoplight diagram (Fig. 2). The values show that precipitation in HR simulation is reduced at higher resolutions across all watersheds for nearly every month of the year. The colors indicate whether this precipitation reduction is an improvement (reduction in bias; green and purple) or not (exacerbation of bias; orange and red). Over the Eastern and Central CONUS, the reduction in precipitation exacerbates or creates a dry bias, while over the Western CONUS, the reduction in precipitation improves model performance and brings the values closer to observed values. The largest changes in bias tend to occur during the warm months, so we focus on June-July-August (JJA) going forward.
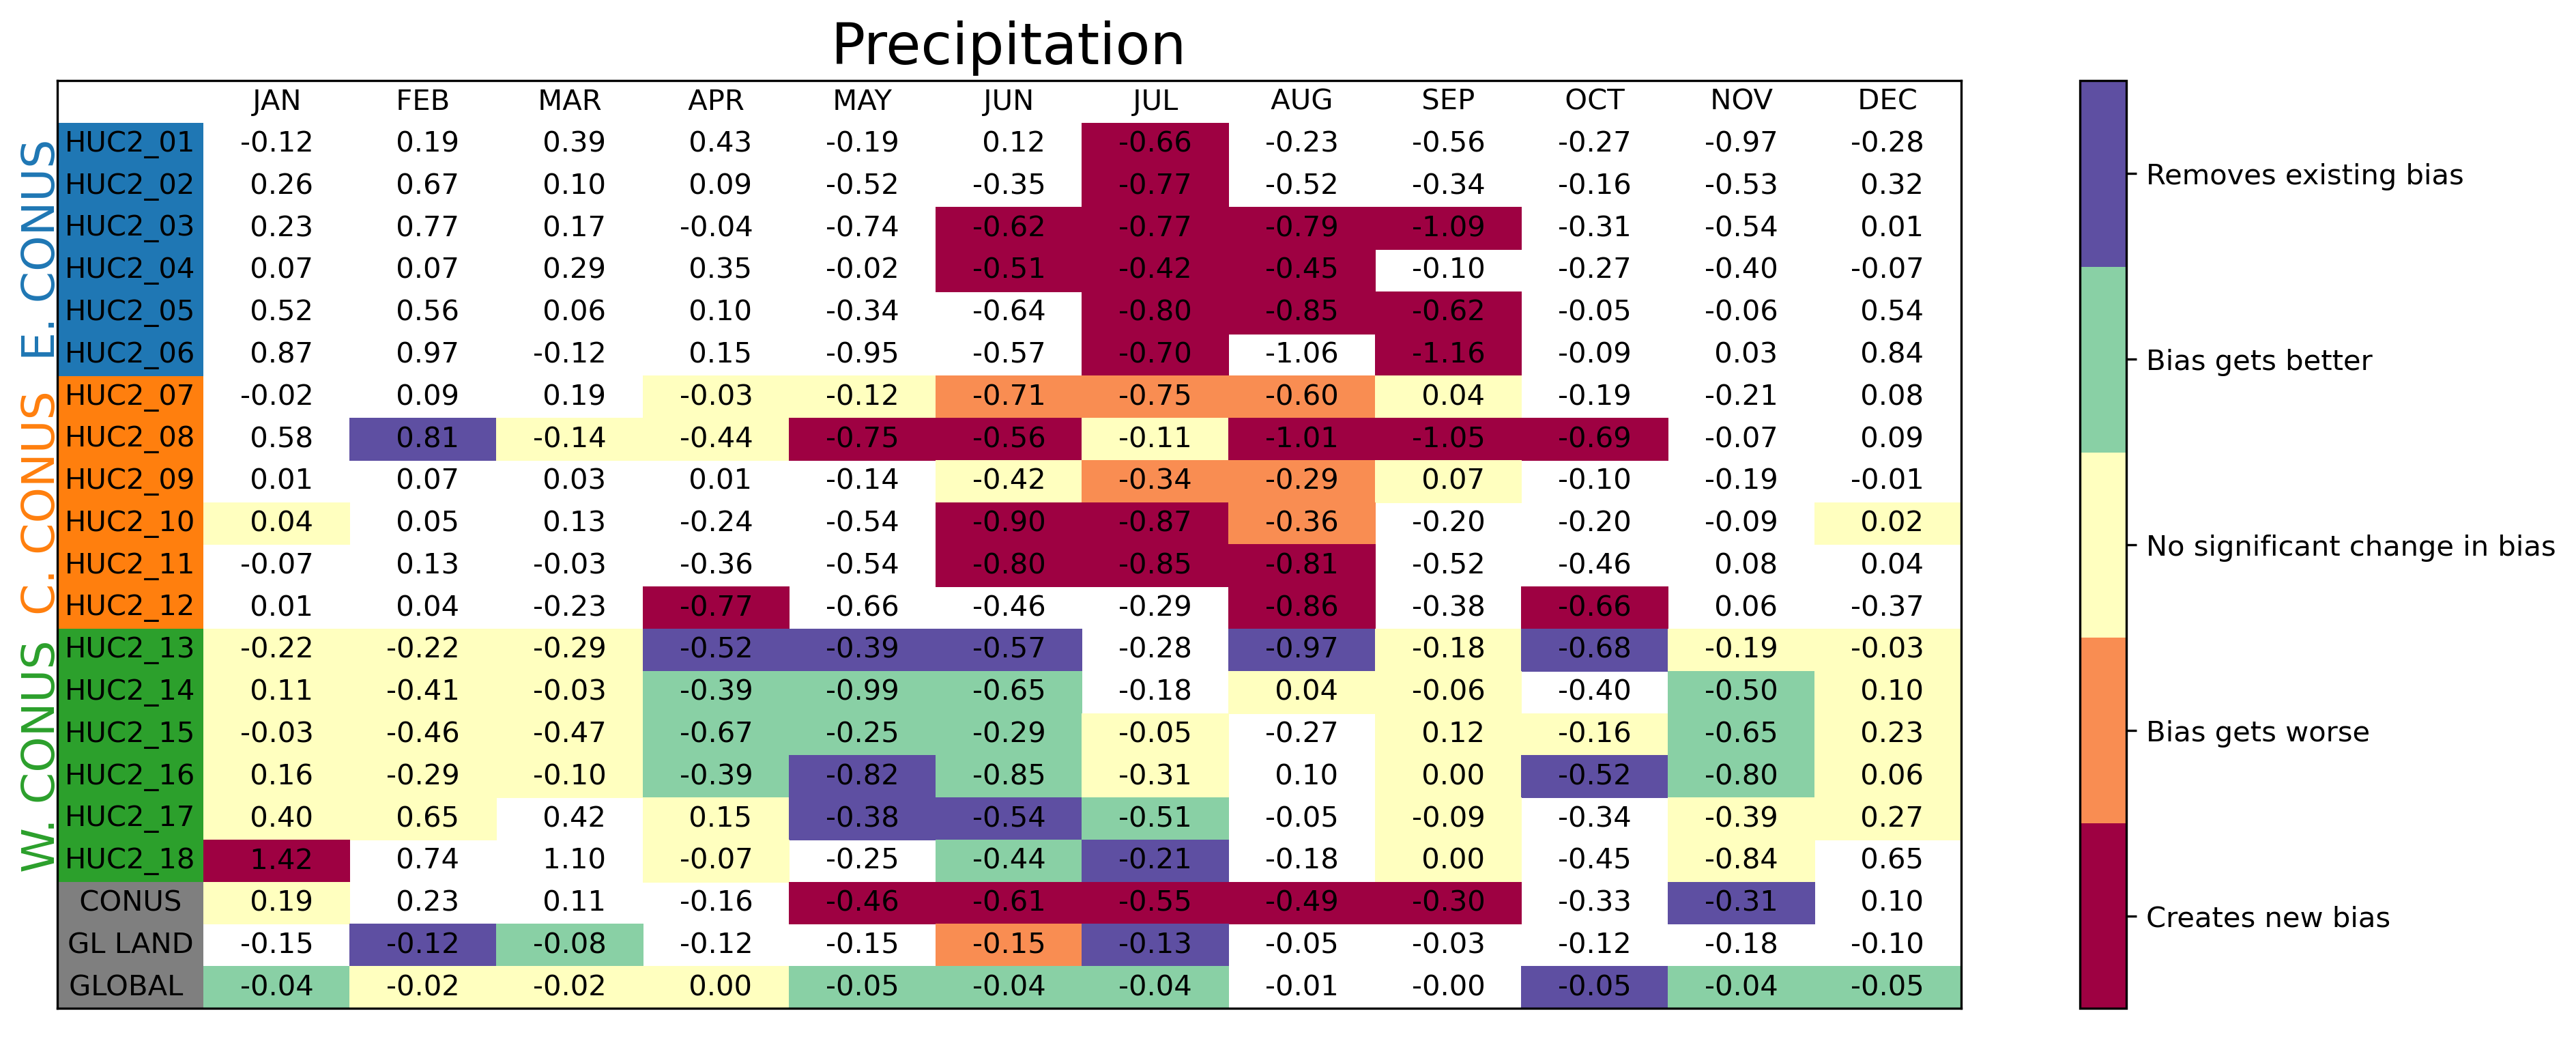
Figure 2: Stoplight diagram for precipitation. Each column represents a month. The first 18 rows each represent a Hydrologic Unit Codes watershed, “CONUS” is the CONUS mean, “GL LAND” is the global land (northward of 60°S) mean, and “GLOBAL” is the global mean. The values in each cell are the mean difference between HR and LR (HR-LR). White denotes a month where no significant bias exists between either LR or HR with the observations. Yellow denotes months where no significant bias exists between LR and HR, but both are significantly biased relative to observations. Purple denotes months where LR is biased relative to observations, while HR is not. Green denotes months where LR is biased relative to observations and HR makes a significant improvement upon that bias. Orange denotes the opposite of green—both LR and HR are biased against observations, but the bias is significantly larger in HR than in LR. Finally, red denotes regions where no bias exists for LR, but a bias does occur for HR. Statistical significance is determined using a two-tailed Student’s t-test with a 95% significance threshold and treating each year as an independent sample for a particular basin and month. Comparison data sets for precipitation include Global Precipitation Climatology Project, Tropical Rainfall Measuring Mission, and ERA5 reanalysis product. Units are in mm/day.
The reduction in precipitation is reflected in reductions in the other water cycle budget terms: evapotranspiration, moisture convergence, terrestrial water storage, and runoff. The maps in Figure 3 show this reduction or slow down of the water cycle across the CONUS (right most column). While the resolution sensitivity is negative for all of the metrics across the CONUS, the bias patterns have much more structure to them, leading to divergent changes in the biases.
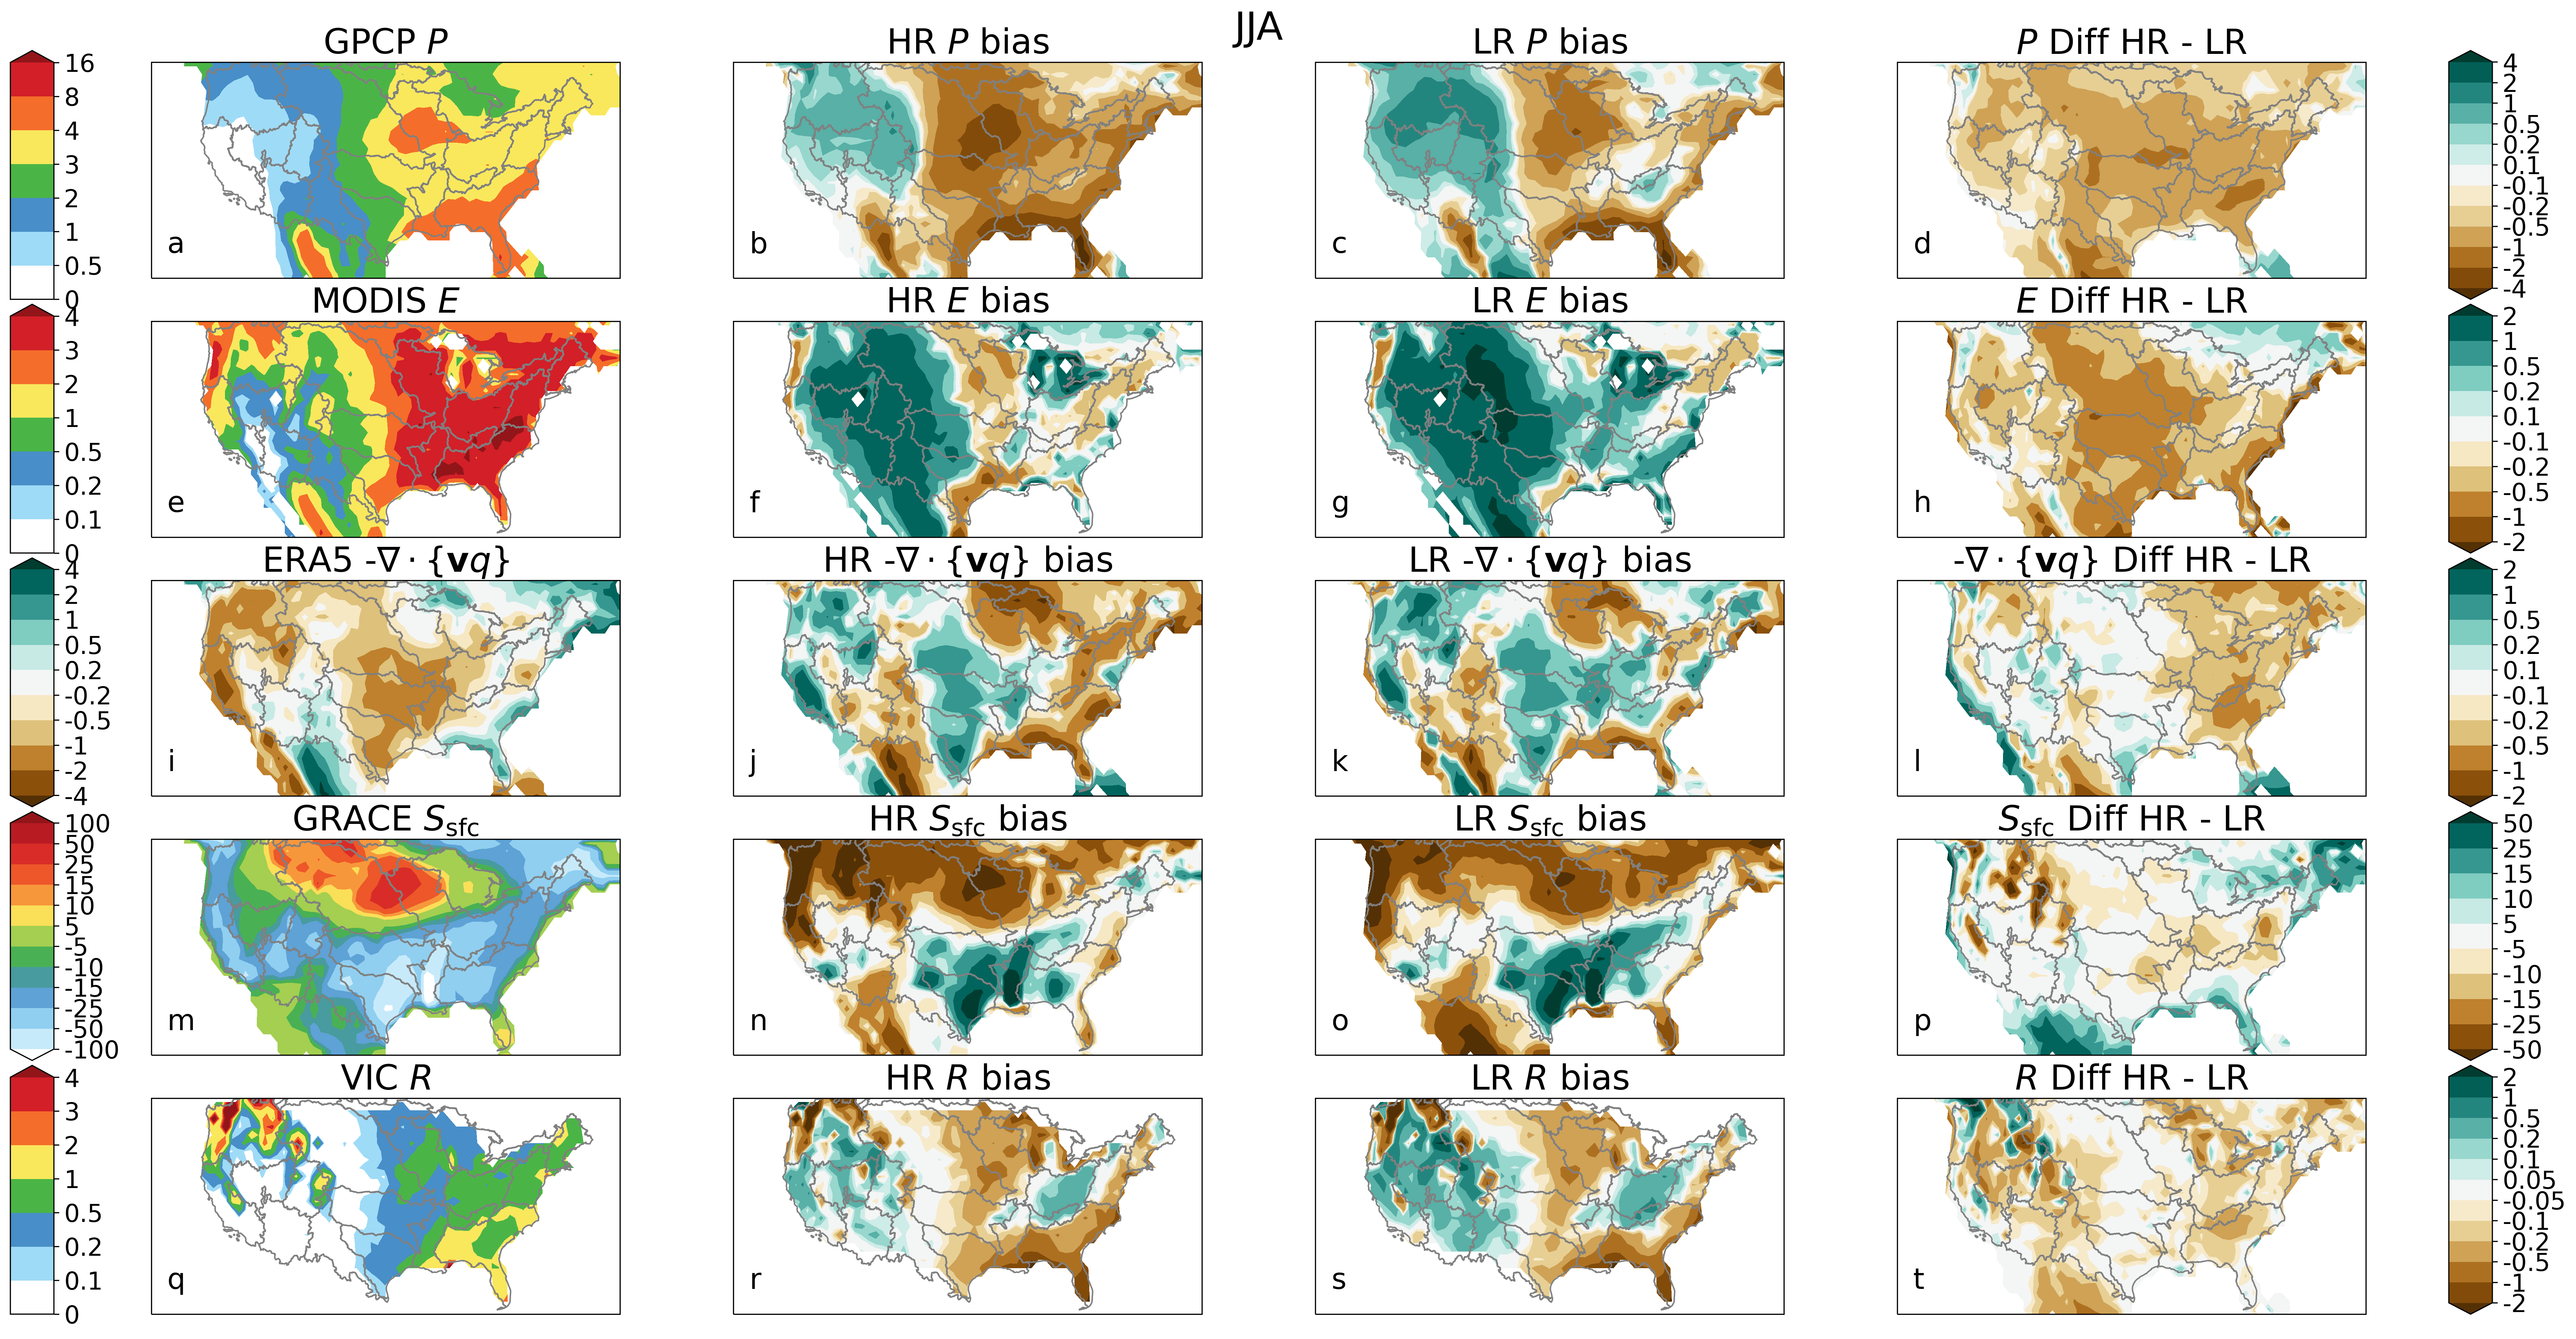
Figure 3: Each of the metrics (precipitation, evapotranspiration, atmospheric moisture convergence, terrestrial water storage anomaly, and runoff) shown for the reference (left-most column), HR and LR bias (second and third columns, respectively), and HR and LR difference (HR minus LR). All values have units of mm/day, except for terrestrial water storage anomaly, which has units of mm.
The responses of the biases are summarized for the Eastern, Central, and Western CONUS in Figure 4. The colored bars reflect the change in each metric owing to resolution, and again, these are all negative. The hatched bars show the bias at LR. The difference (HR-LR) should be opposite in sign and smaller in magnitude compared to the LR bias for HR to be considered better than LR. Where the sign of the colored and hatched bars agree, the bias is exacerbated. It is clear that increasing resolution has mixed results depending on both region and variable of interest in terms of improving or degrading model performance.
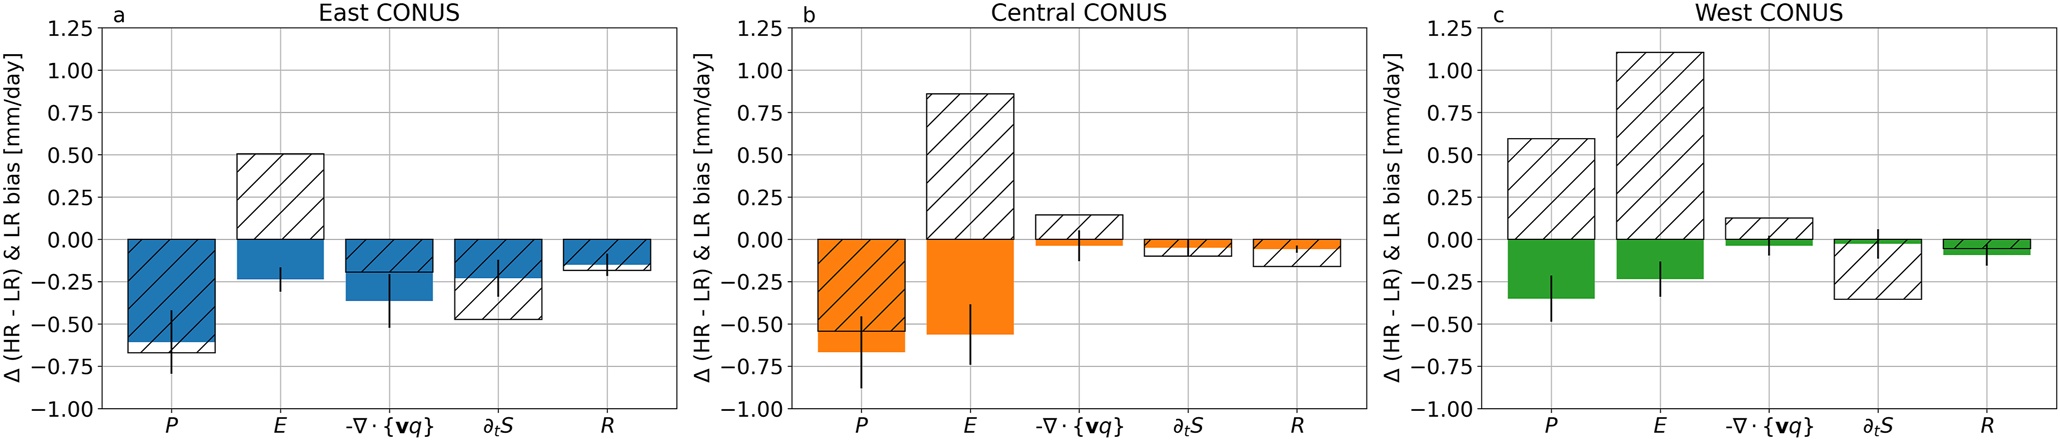
Figure 4: Mean difference between LR and HR (colored bars), and mean bias for LR (hatched bars) for precipitation, ET, atmospheric moisture convergence, terrestrial water storage tendency, and runoff for (a) Eastern CONUS, (b) Central CONUS, and (c) Western CONUS. The error bars provide the 95% confidence interval for the mean differences. All values have units of mm/day.
Response of Storms to Resolution
While the mean response to increasing resolution was mixed, it was expected that increasing resolution would improve process representation for extremes and other finer scale water cycle features. Figure 5 shows modest improvement to extreme precipitation for both winter and summer. Instead of extreme precipitation increasing with resolution across the CONUS, both increases and decreases occur, but generally act to reduce biases relative to observed precipitation. Though some of the changes are not statistically significant at the 95% level, the improvements agree with findings from prior grid-point studies (Mahajan et al. 2015, Wehner et al. 2010, 2014).
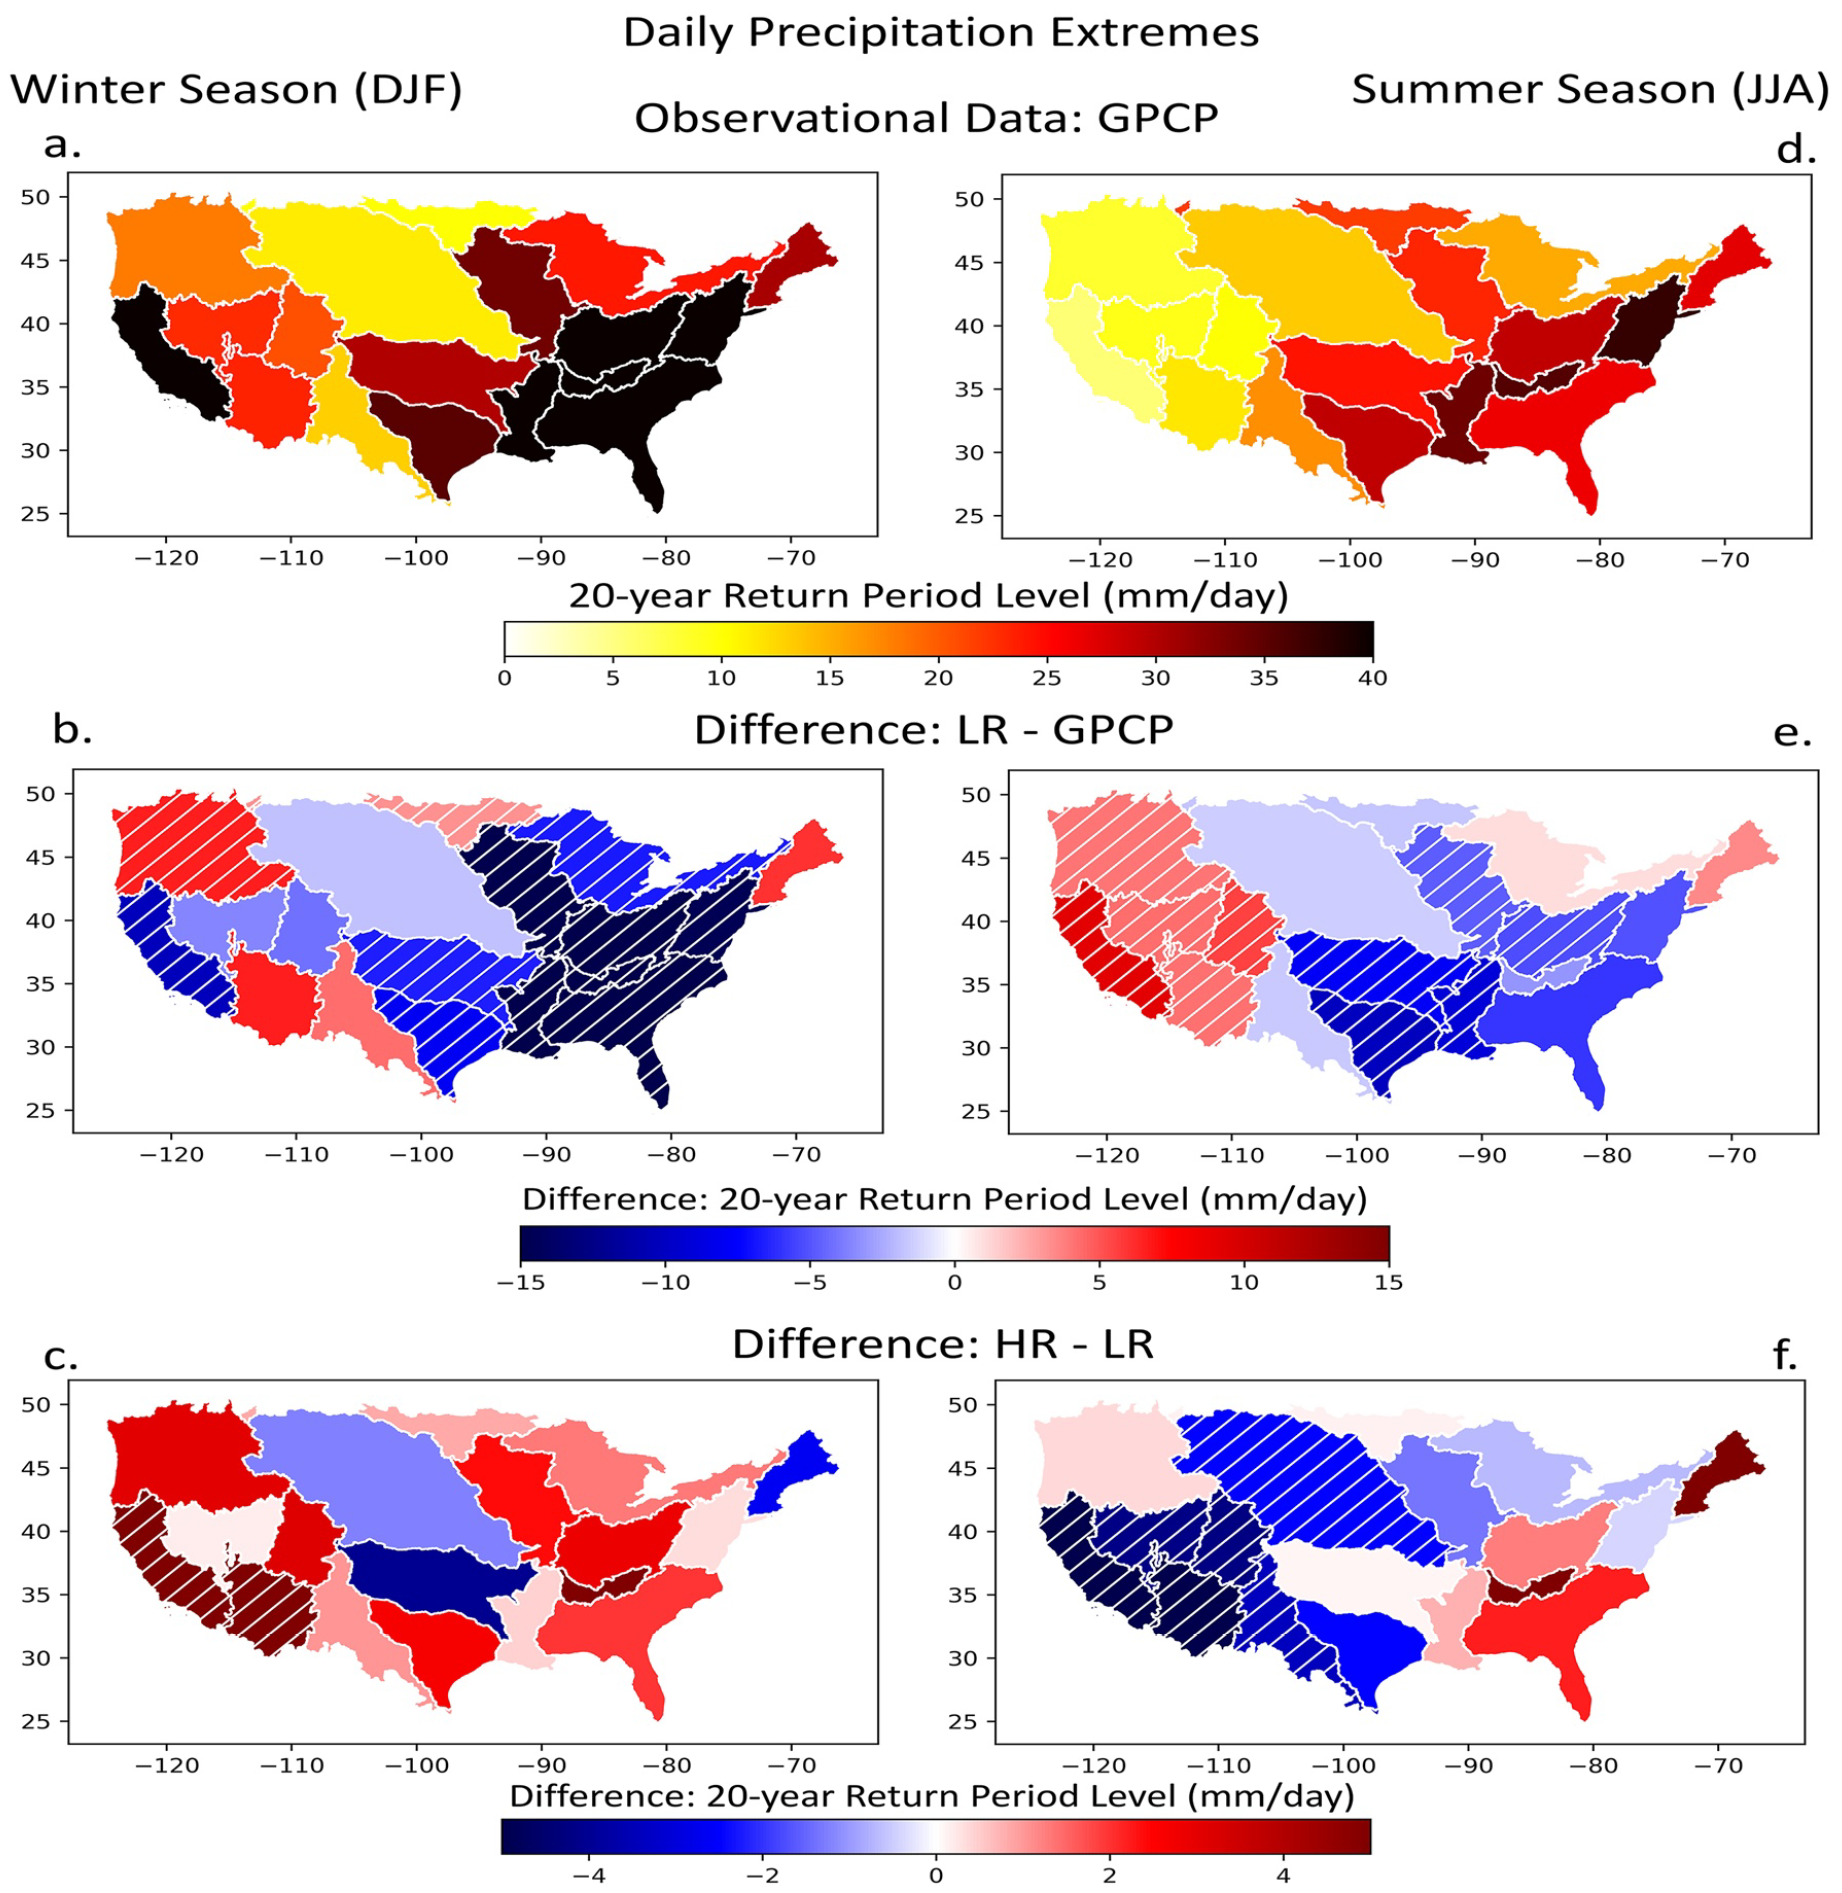
Figure 5: Return levels of 20-year extreme events. Return levels of 20-year extremes of daily precipitation aggregated over Hydrologic Unit Codes watershed scales for Global Precipitation Climatology Project (GPCP) precipitation data during (a) winter and (d) summer season. Difference between (b, e) LR and GPCP and between (c, f) HR and LR for winter and summer season. Hatching in (b), (c), (e), (f) indicates watersheds where the difference in return levels are statistically different from zero at the 95% confidence level.
Storm systems such as Tropical Cyclones (TCs), Atmospheric Rivers (ARs), and Extratropical Cyclones (ETCs) can account for upwards of 50% of the precipitation over parts of CONUS. Modest improvements in the fraction of precipitation from each of these storm types is found when resolution is increased in E3SM (Fig. 6). Overall, more precipitation falls from these storm features as measured by a reduction in the residual precipitation category with increasing resolution.
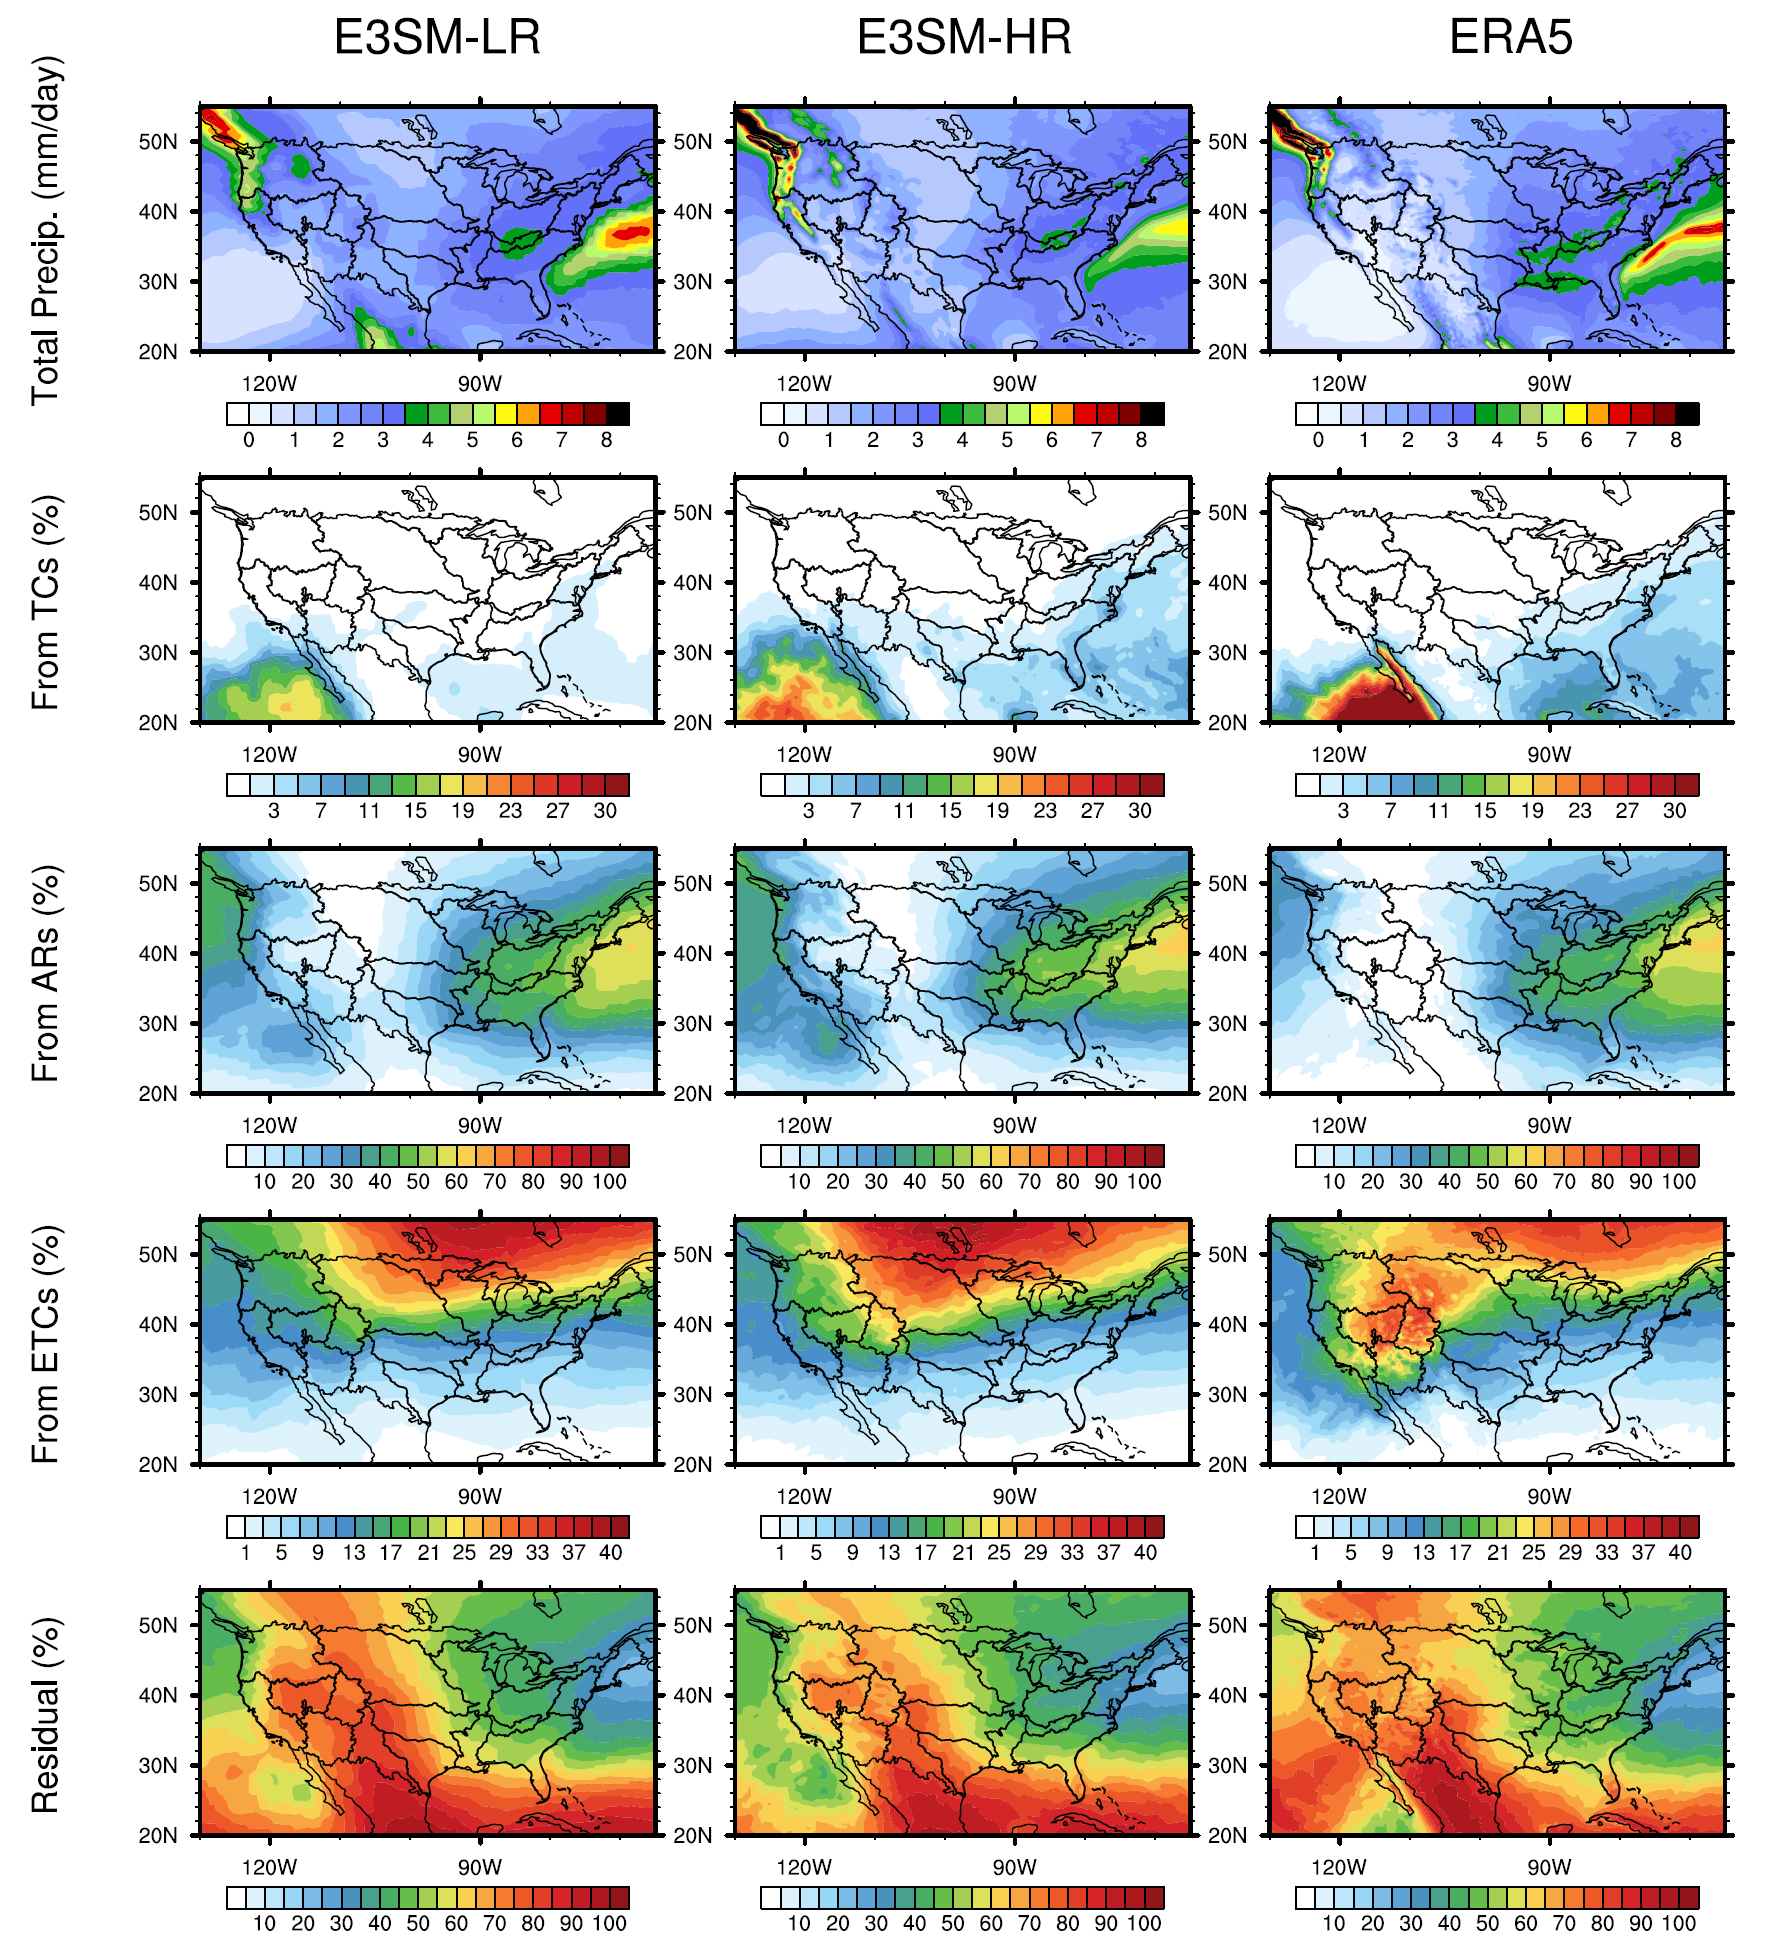
Figure 6: Total annual precipitation from E3SM-LR, E3SM-HR, and ERA5 reanalysis (in mm/day), and fractional contribution of precipitation associated with three tracked feature types: tropical cyclones, atmospheric rivers, extratropical cyclones, and residual precipitation.
Snowpack is sensitive to the representation of topography in the model. At 25 km grid spacing, the mountainous Western CONUS is much more realistic than the smooth topography used by the LR model. As a result, improvements in virtually all measures of snowpack (e.g. its accumulation rate, peak water volume, snow season length) show improvement with increasing resolution (Fig. 7).
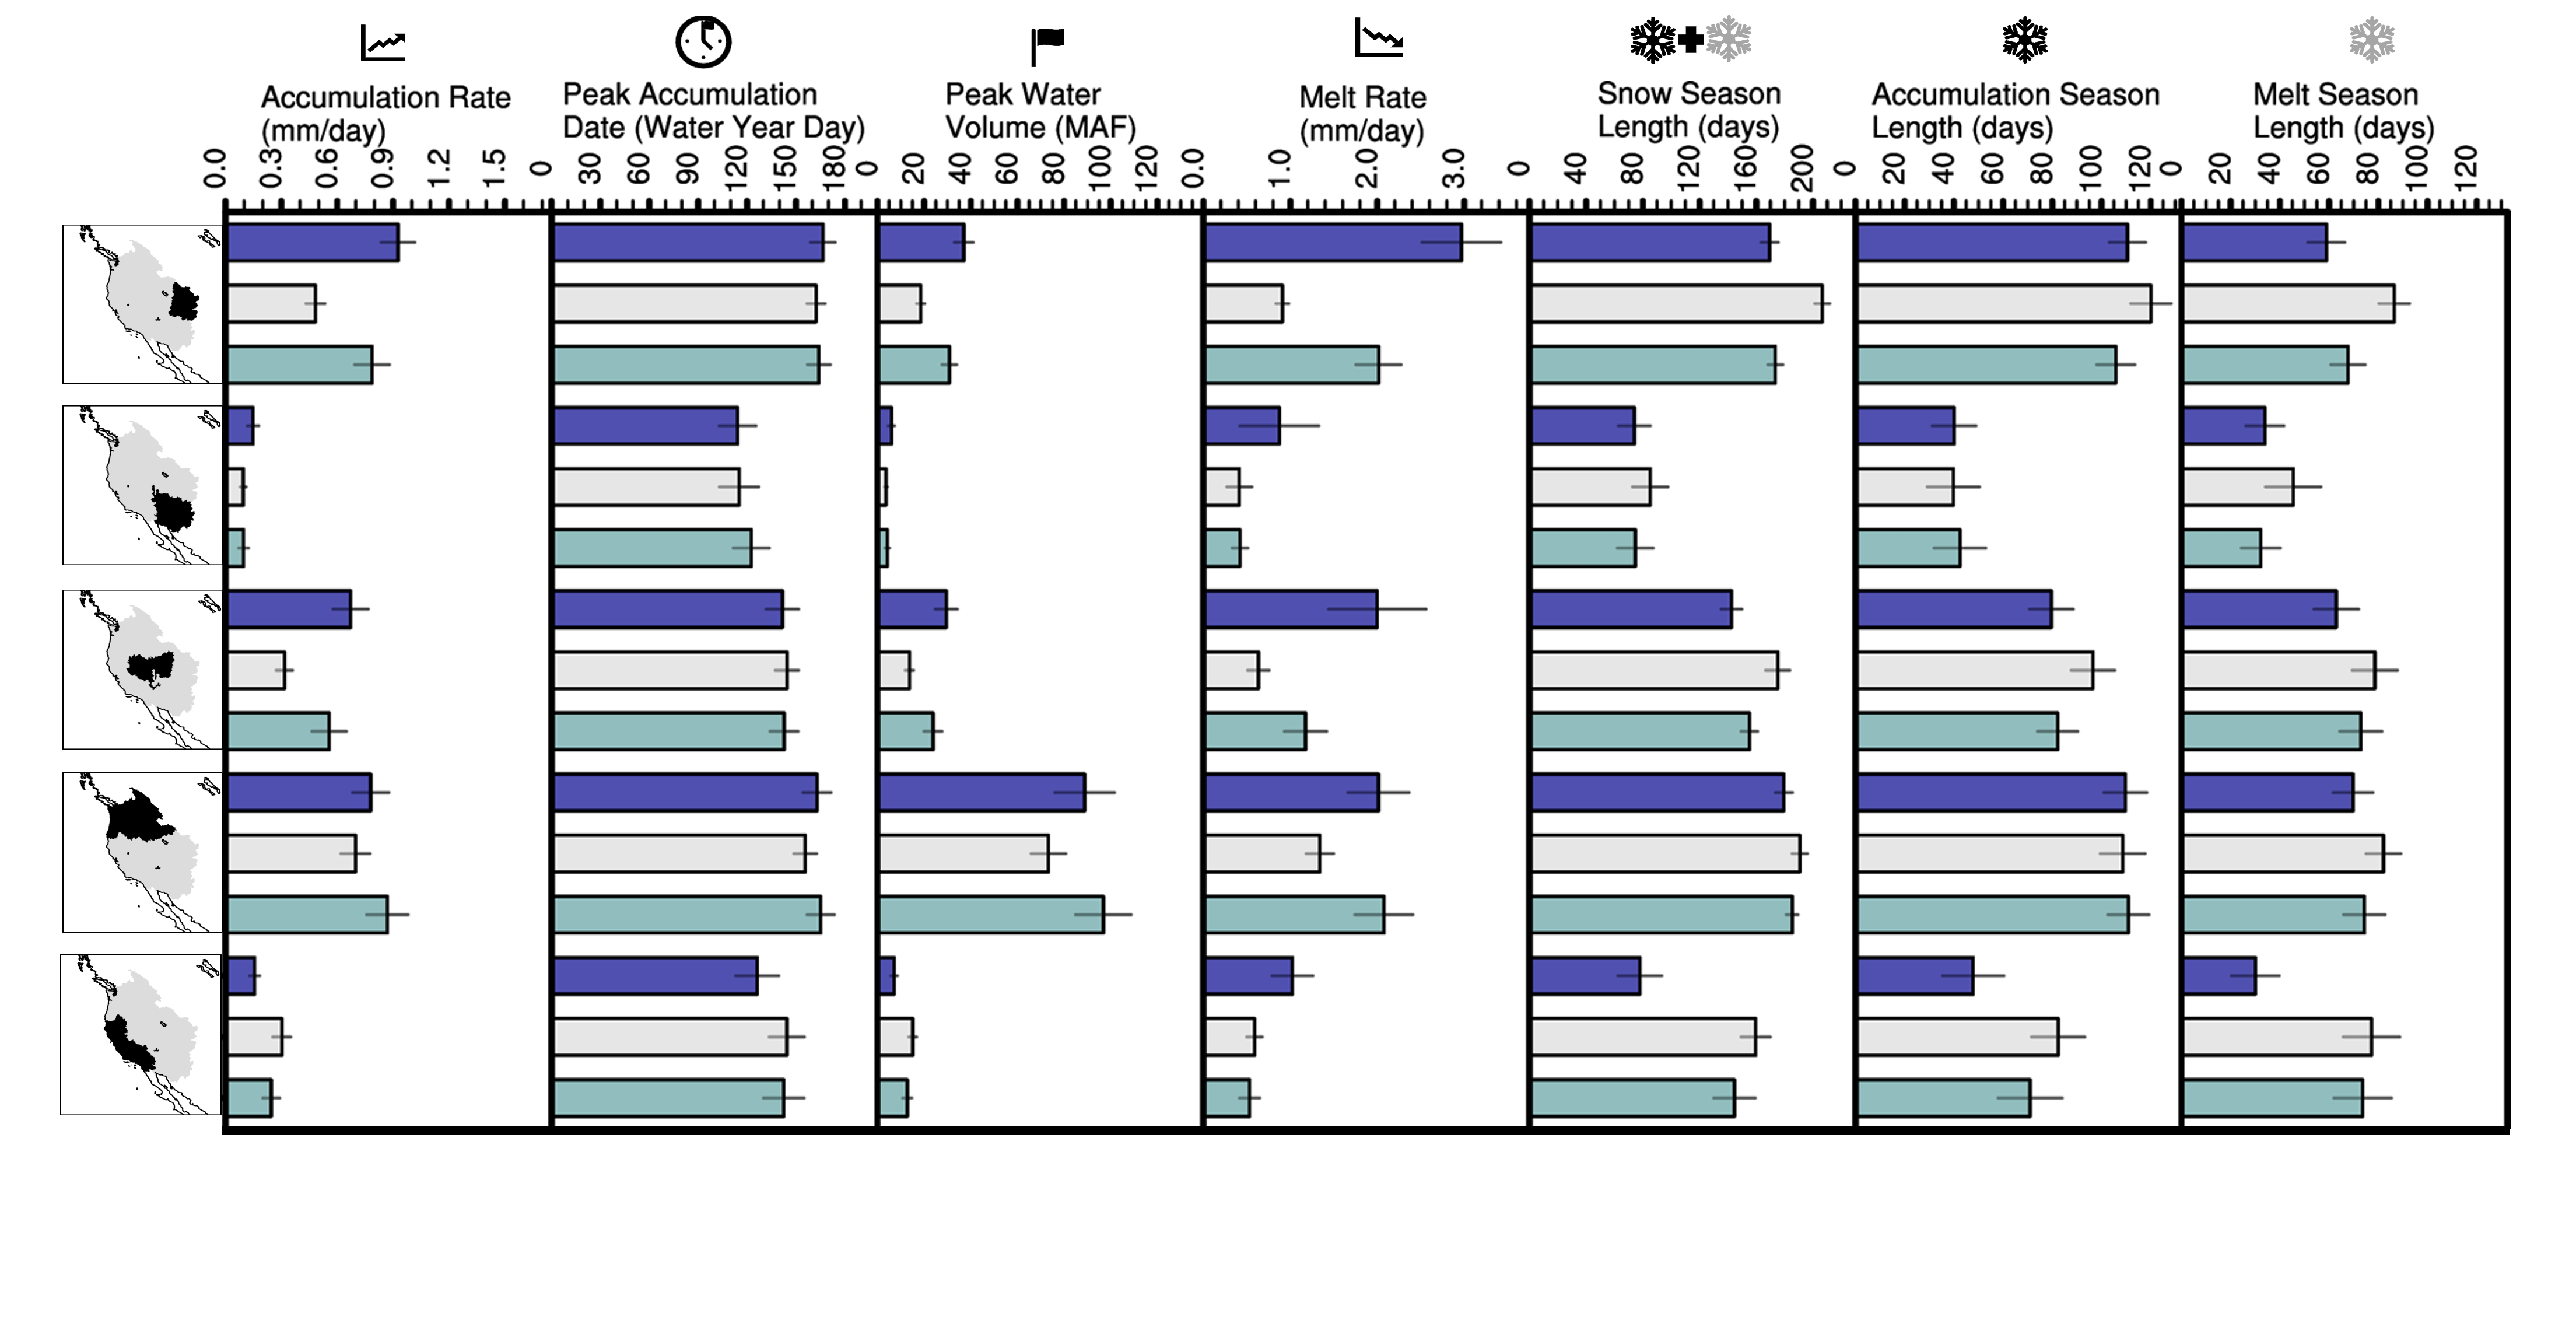
Figure 7: The seasonal snow cycle is characterized by its daily snow water equivalent (SWE) and linearly decomposed using the SWE triangle methodology to assess the western United States mountainous hydrologic units for the E3SM low-resolution (LR, 1.00°, blue) and high-resolution (HR, 0.25°, aquamarine) simulations spanning 1985–2014. ERA5 is shown in gray. The bars indicate the 30-year climatological average conditions simulated across all five mountainous hydrologic units of the western United States (in order of appearance in each row from top to bottom, Upper Colorado, Lower Colorado, Great Basin, Pacific Northwest, and California) for each of the seven SWE triangle metrics (columns and histograms) with 95% confidence intervals indicated (black lines).
Summary
The resolution sensitivity of the seasonal water cycle was examined over the CONUS at the HUC2 watershed scale using E3SMv1 simulations run at low and high resolution. The results show a slow down of the warm season water cycle with increasing resolution, with decreases in precipitation, evapotranspiration, moisture convergence, terrestrial water storage, and runoff. As seen above, whether the decreases in these terms result in reductions in biases or not depend on the region and the budget term. These differences highlight some of the difficulty in correcting biases in models like E3SM.
While this study highlights many important sensitivities of the water cycle to model resolution, one aspect that is not covered is how resolution might change the sensitivity of the water cycle to earth system changes. More work is needed to understand what, if any, impacts increased horizontal resolution in E3SM has on the water cycle response to transient warming. Given its importance to society, continued effort is needed for understanding how earth system models like E3SM represent the water cycle and its sensitivity to changes within those models.
Code and Data Availability
Complete native model output is archived on HPSS system at NERSC (National Energy Research Scientific Computing Center). The dataset is available through the DOE Earth System Grid Federation (ESGF; Cinquini et al., 2014) at ESGF MetaGrid. The output presented in this manuscript will be made available from Get E3SM Data. Some of the figures presented herein were generated in part using E3SM Diags (C. Zhang et al., 2022; C. J. Zhang et al., 2022). NCO (C. S. Zender, 2008; C. Zender et al., 2022) was used to generate climatologies and for data regridding.
Reference
- Harrop, B. E., Balaguru, K., Golaz, J., Leung, L. R., Mahajan, S., Rhoades, A. M., et al. (2023). Evaluating the Water Cycle Over CONUS at the Watershed Scale for the Energy Exascale Earth System Model Version 1 (E3SMv1) Across Resolutions. Journal of Advances in Modeling Earth Systems, 15(11), e2022MS003490. https://doi.org/10.1029/2022MS003490
Acknowledgment
This research was supported as part of the Energy Exascale Earth System Model (E3SM) project, funded by the U.S. Department of Energy, Office of Science, Office of Biological and Environmental Research (BER). Author Rhoades was funded by the Office of Biological and Environmental Research of the U.S. Department of Energy within the Regional and Global Model Analysis (RGMA) Program program under the “Calibrated and Systematic Characterization, Attribution and Detection of Extremes (CASCADE)” Science Focus Area (award no. DE-AC02-05CH11231). Authors Rhoades and Ullrich were funded by the project “A Framework for Improving Analysis and Modeling of Earth System and Intersectoral Dynamics at Regional Scales” (award no. DE-SC0016605).
The data were produced using resources of the Argonne Leadership Computing Facility at Argonne National Laboratory, which is supported by the Office of Science of the U.S. Department of Energy under contract DE-AC02-06CH11357. The data were produced using resources of the National Energy Research Scientific Computing Center, a DOE Office of Science User Facility supported by the Office of Science of the U.S. Department of Energy under Contract No. DE-AC02- 05CH11231.
Related Articles
- E3SM v1.0 Overview Paper on Coupled Model
Contact
- Bryce Harrop, Pacific Northwest National Laboratory
This article is a part of the E3SM “Floating Points” Newsletter, to read the full Newsletter check: