

Overview of High-Res Coupled Model
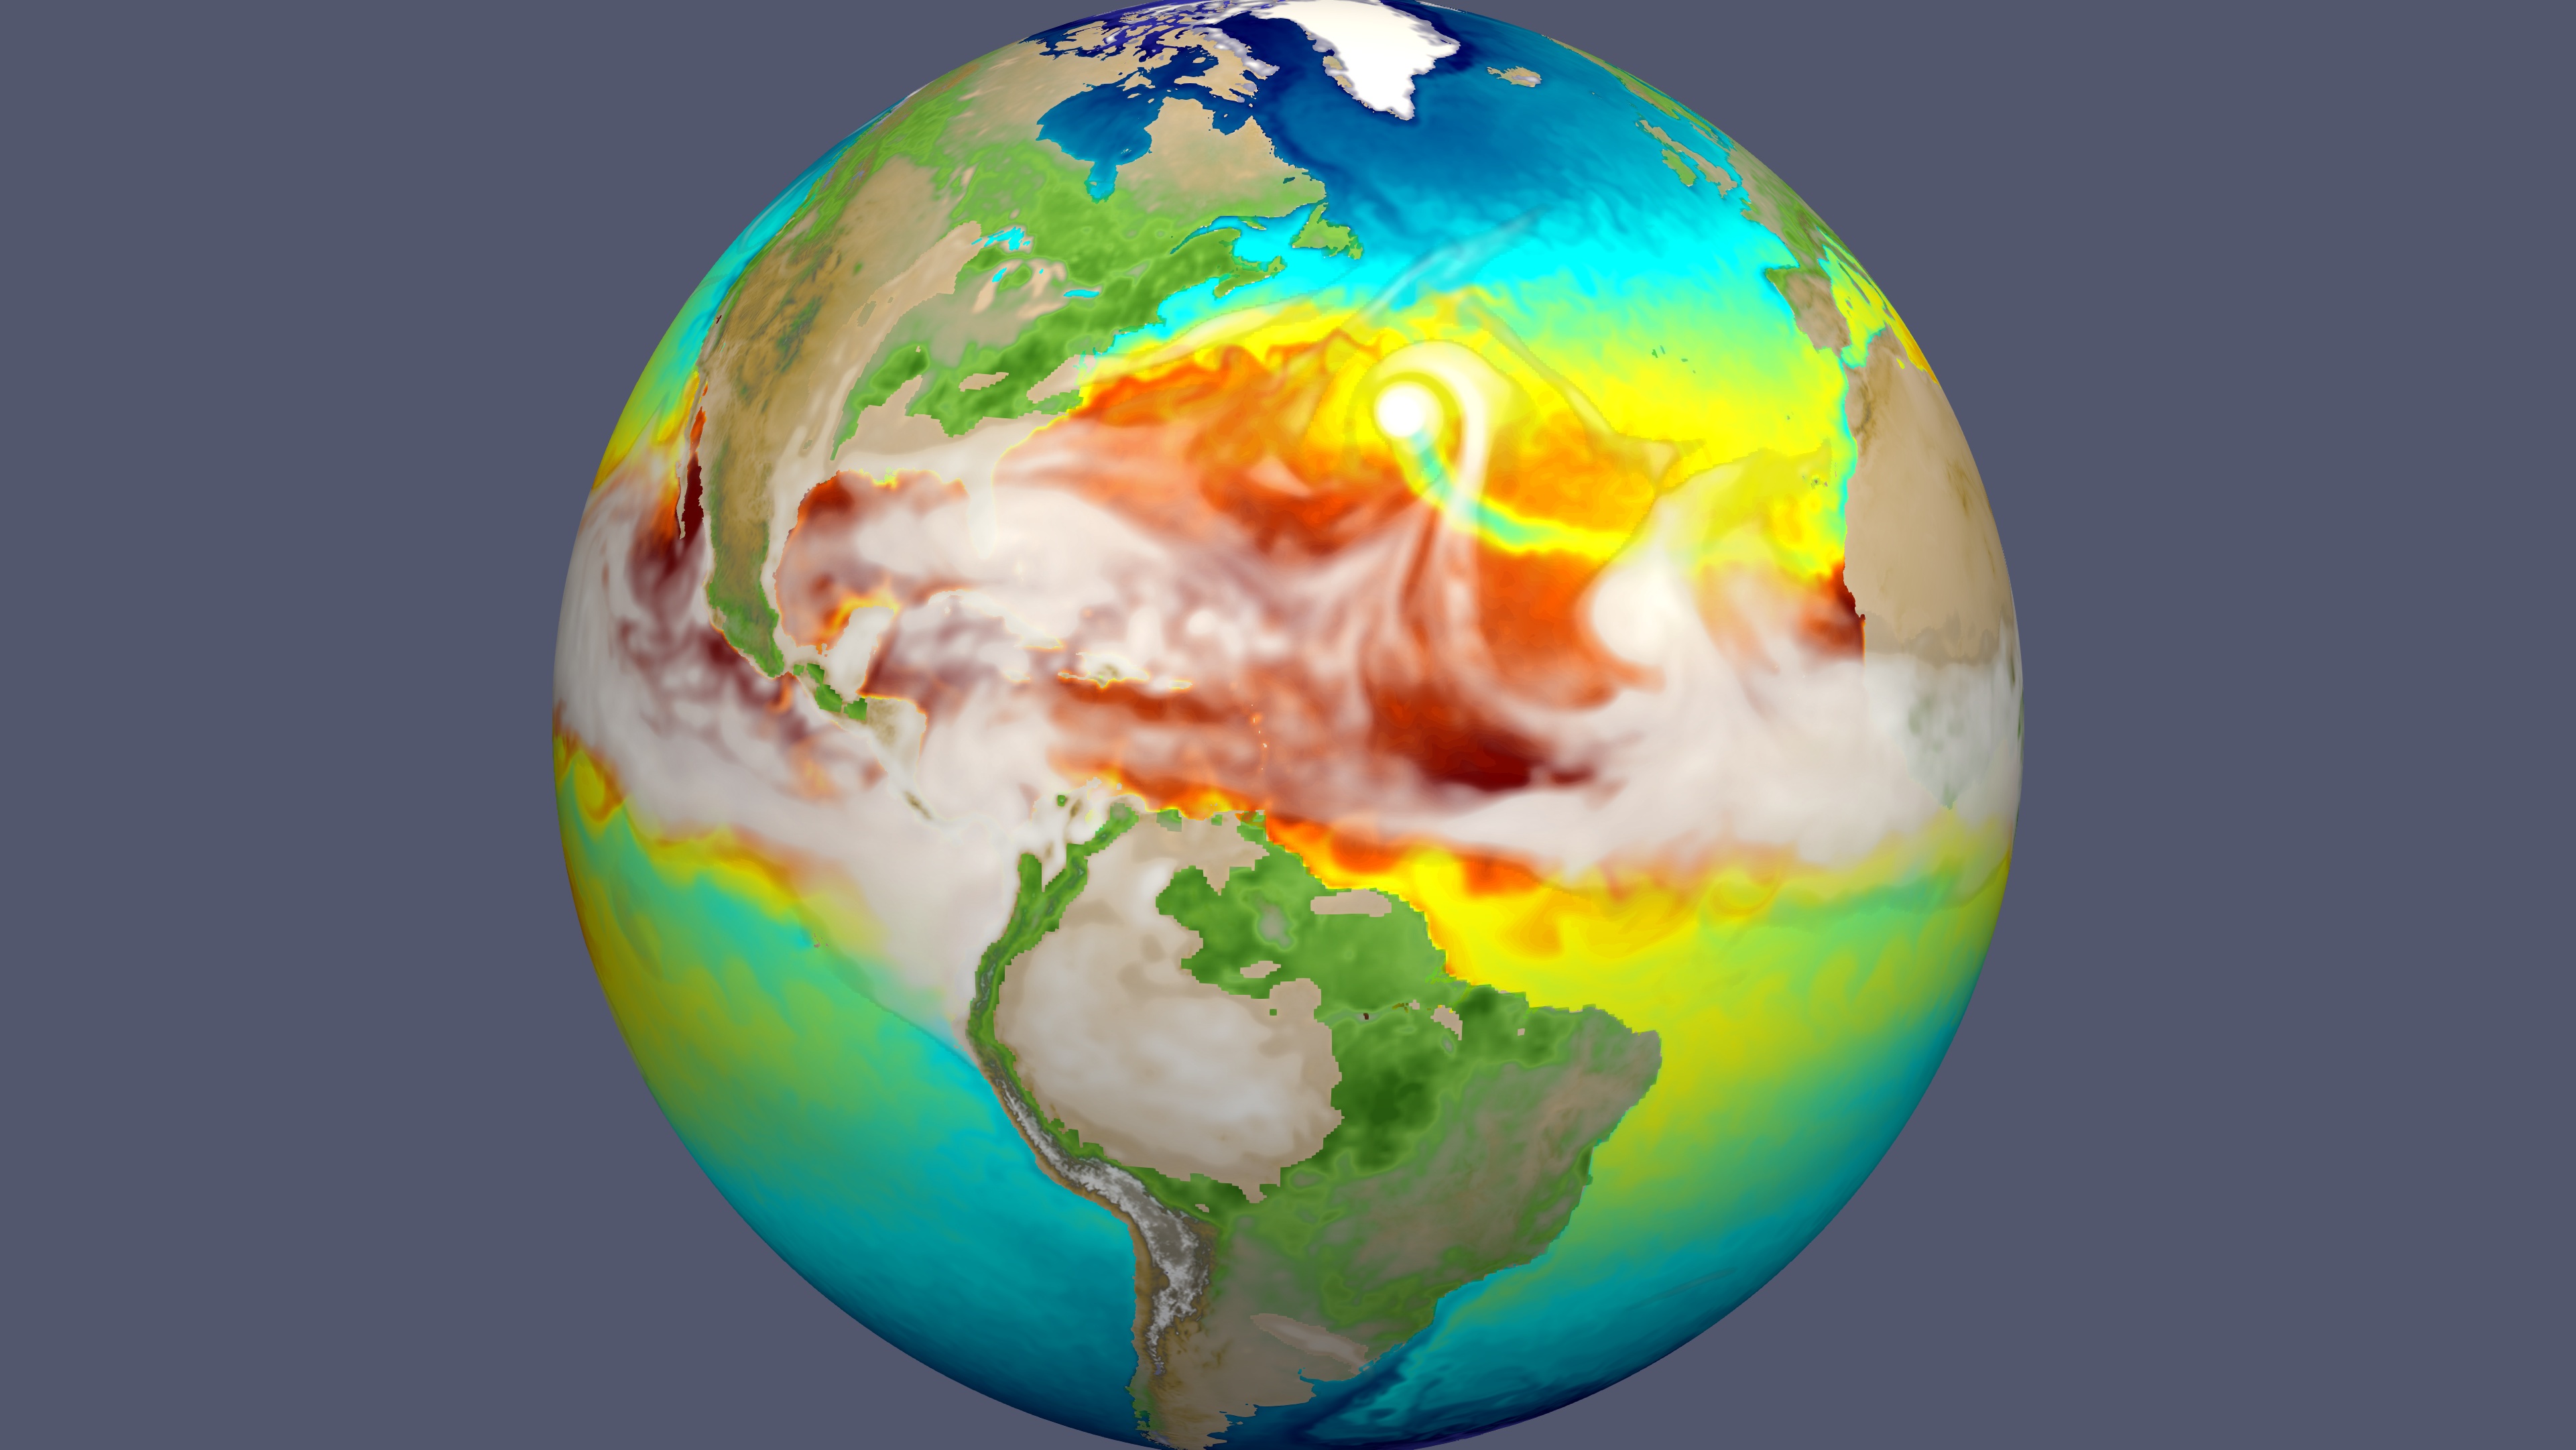
The high-resolution Energy Exascale Earth System Model (E3SM) captures hurricanes with surface winds exceeding 150 mph. In this image, a large hurricane is visible as a bullseye of white (high water vapor) in the mid-Atlantic, leaving a trail of cold (green) sea surface temperature in an otherwise warm ocean (yellow/red colors).
Paper Overview: the DOE E3SM coupled model version 1 – description and results at high resolution.
In November 2019, the Journal of Advances in Modeling Earth Systems (JAMES) published a paper documenting and evaluating the performance of the high-resolution E3SM version 1 model (DOI: 10.1029/2019MS001870).
This paper serves as the main reference for the E3SM v1 high-resolution model.
Background
The Energy Exascale Earth System Model version 1 (E3SMv1) release provides support for two horizontal resolutions. The standard- or low- resolution version (hereafter LR) uses ~100 km grid spacing for land and atmosphere and 30-60 km grid spacing for ocean and sea ice. This lower resolution model was highlighted in an earlier newsletter article: “Overview Paper on Coupled Model”. With ~25 km grid spacing for land and atmosphere and 6-18 km grid spacing in the ocean and sea ice components, the high-resolution (HR) version of E3SMv1 is able to explicitly resolve the most energetic eddies in the ocean, which play a key role in planetary circulation, as well as resolving the biggest storms in the atmosphere, which have major impacts on humans. At standard resolution, the effect of these processes can only be included via parameterizations, which are idealized or empirical relationships based on available grid-scale average properties. These parameterizations, which are necessarily simplified and imperfect, are often credited as being the main source of uncertainty about climate change. As one might expect, finer resolution has historically led to improved simulation of the current climate and is expected to provide more accurate projections of the future.
Running at finer resolution is not without its challenges, however. Doubling the horizontal resolution results in a roughly 8x increase in computational cost (due to having 4x more grid cells and requiring a ~2x shorter timestep for stability). As a result, only a few modeling centers can afford to perform simulations at the resolution of the E3SMv1 HR model. With its strong interest in climate change and large investment in cutting-edge supercomputers, the US Department of Energy (DOE) is perfectly positioned to be a leader in high-resolution climate simulation. As a first application, a team of E3SM scientists performed a 50 year-long HR simulation of the 1950s period using Argonne Leadership Computing Facility’s Theta supercomputer. This simulation consumed ~100 million core hours and completed about 7 simulated years for every 10 days of computation.
Results from this high-resolution simulation are described in the JAMES article mentioned above, which is titled “The DOE E3SM Coupled Model Version 1: Description and Results at High Resolution”. Highlights of that article are presented below.
Results
Because high-resolution calculations are so costly (both in terms of computer resources and number of days required to complete a simulation), the HR run was initialized based on ~10 yrs of idealized spin-up simulations. This isn’t long enough for the earth system to come into equilibrium, so it is unsurprising that the planet is cooling slightly throughout the simulation and the top of the atmosphere is radiating ~0.5 W m-2 to space (see Fig. 1). Sea-ice concentration is reassuringly steady. A short spin-up period and associated drifts are a common feature of high-resolution coupled simulations; developing strategies to improve this simulation is important future work.
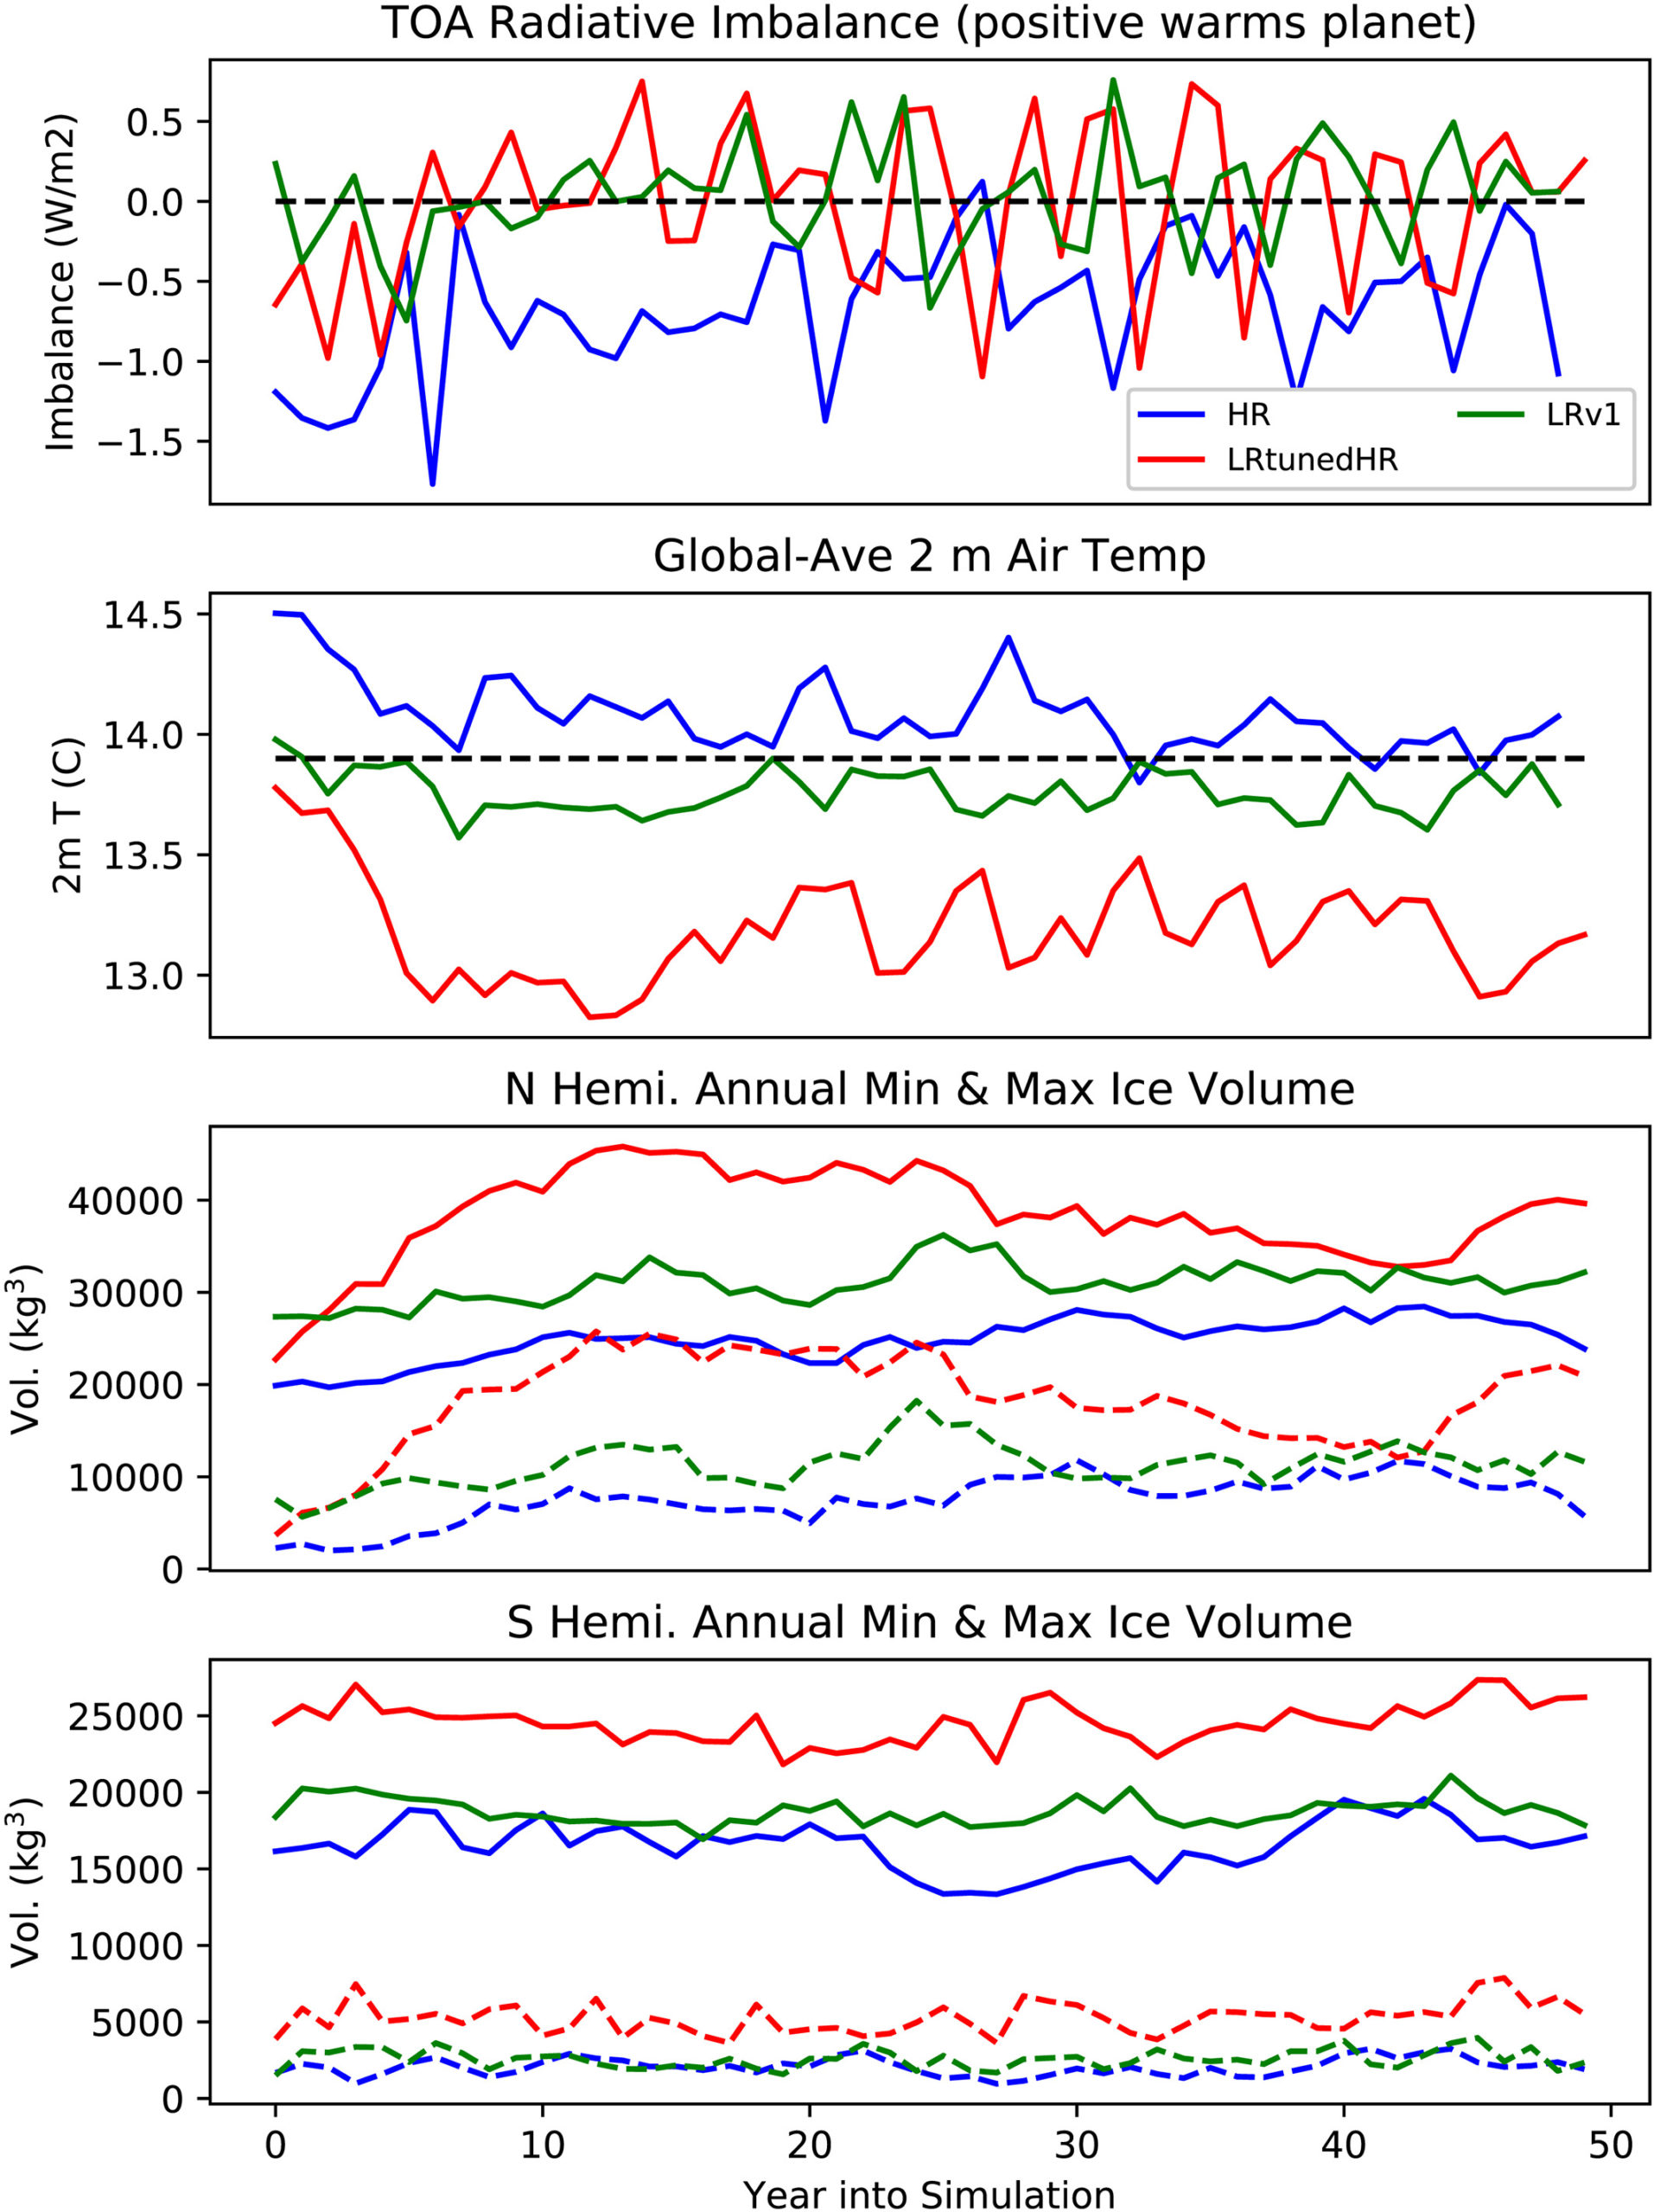
Figure 1. The time evolution of (from top to bottom) global-mean top-of-atmosphere (TOA) radiative imbalance, global-mean 2 m air temperature, northern-hemisphere maximum and minimum ice volume, and southern-hemisphere maximum and minimum ice volume. All quantities are annual averages. HR (in blue) is the new high-resolution simulation, LRv1 (green) is the standard-resolution E3SMv1 release described in Golaz et al. (2019), and LRtunedHR (red) is the standard-resolution E3SMv1 using the tuning settings from the HR simulation.
Current-climate bias metrics in HR are generally improved relative to the standard-resolution E3SMv1 model, which is itself generally superior to most CMIP5 models (see Fig. 2). Performance is particularly good for radiative quantities, precipitation, and surface temperature and closer to average for the fluid dynamics properties (shown on the bottom row of Fig. 2). Improvement with resolution comes from a combination of finer grid spacing, different tuning between HR and LR simulations, and shorter spin-up time (which limits error growth). Snowpack, river runoff, hurricanes and orographic and extreme precipitation are particularly improved by increased resolution.
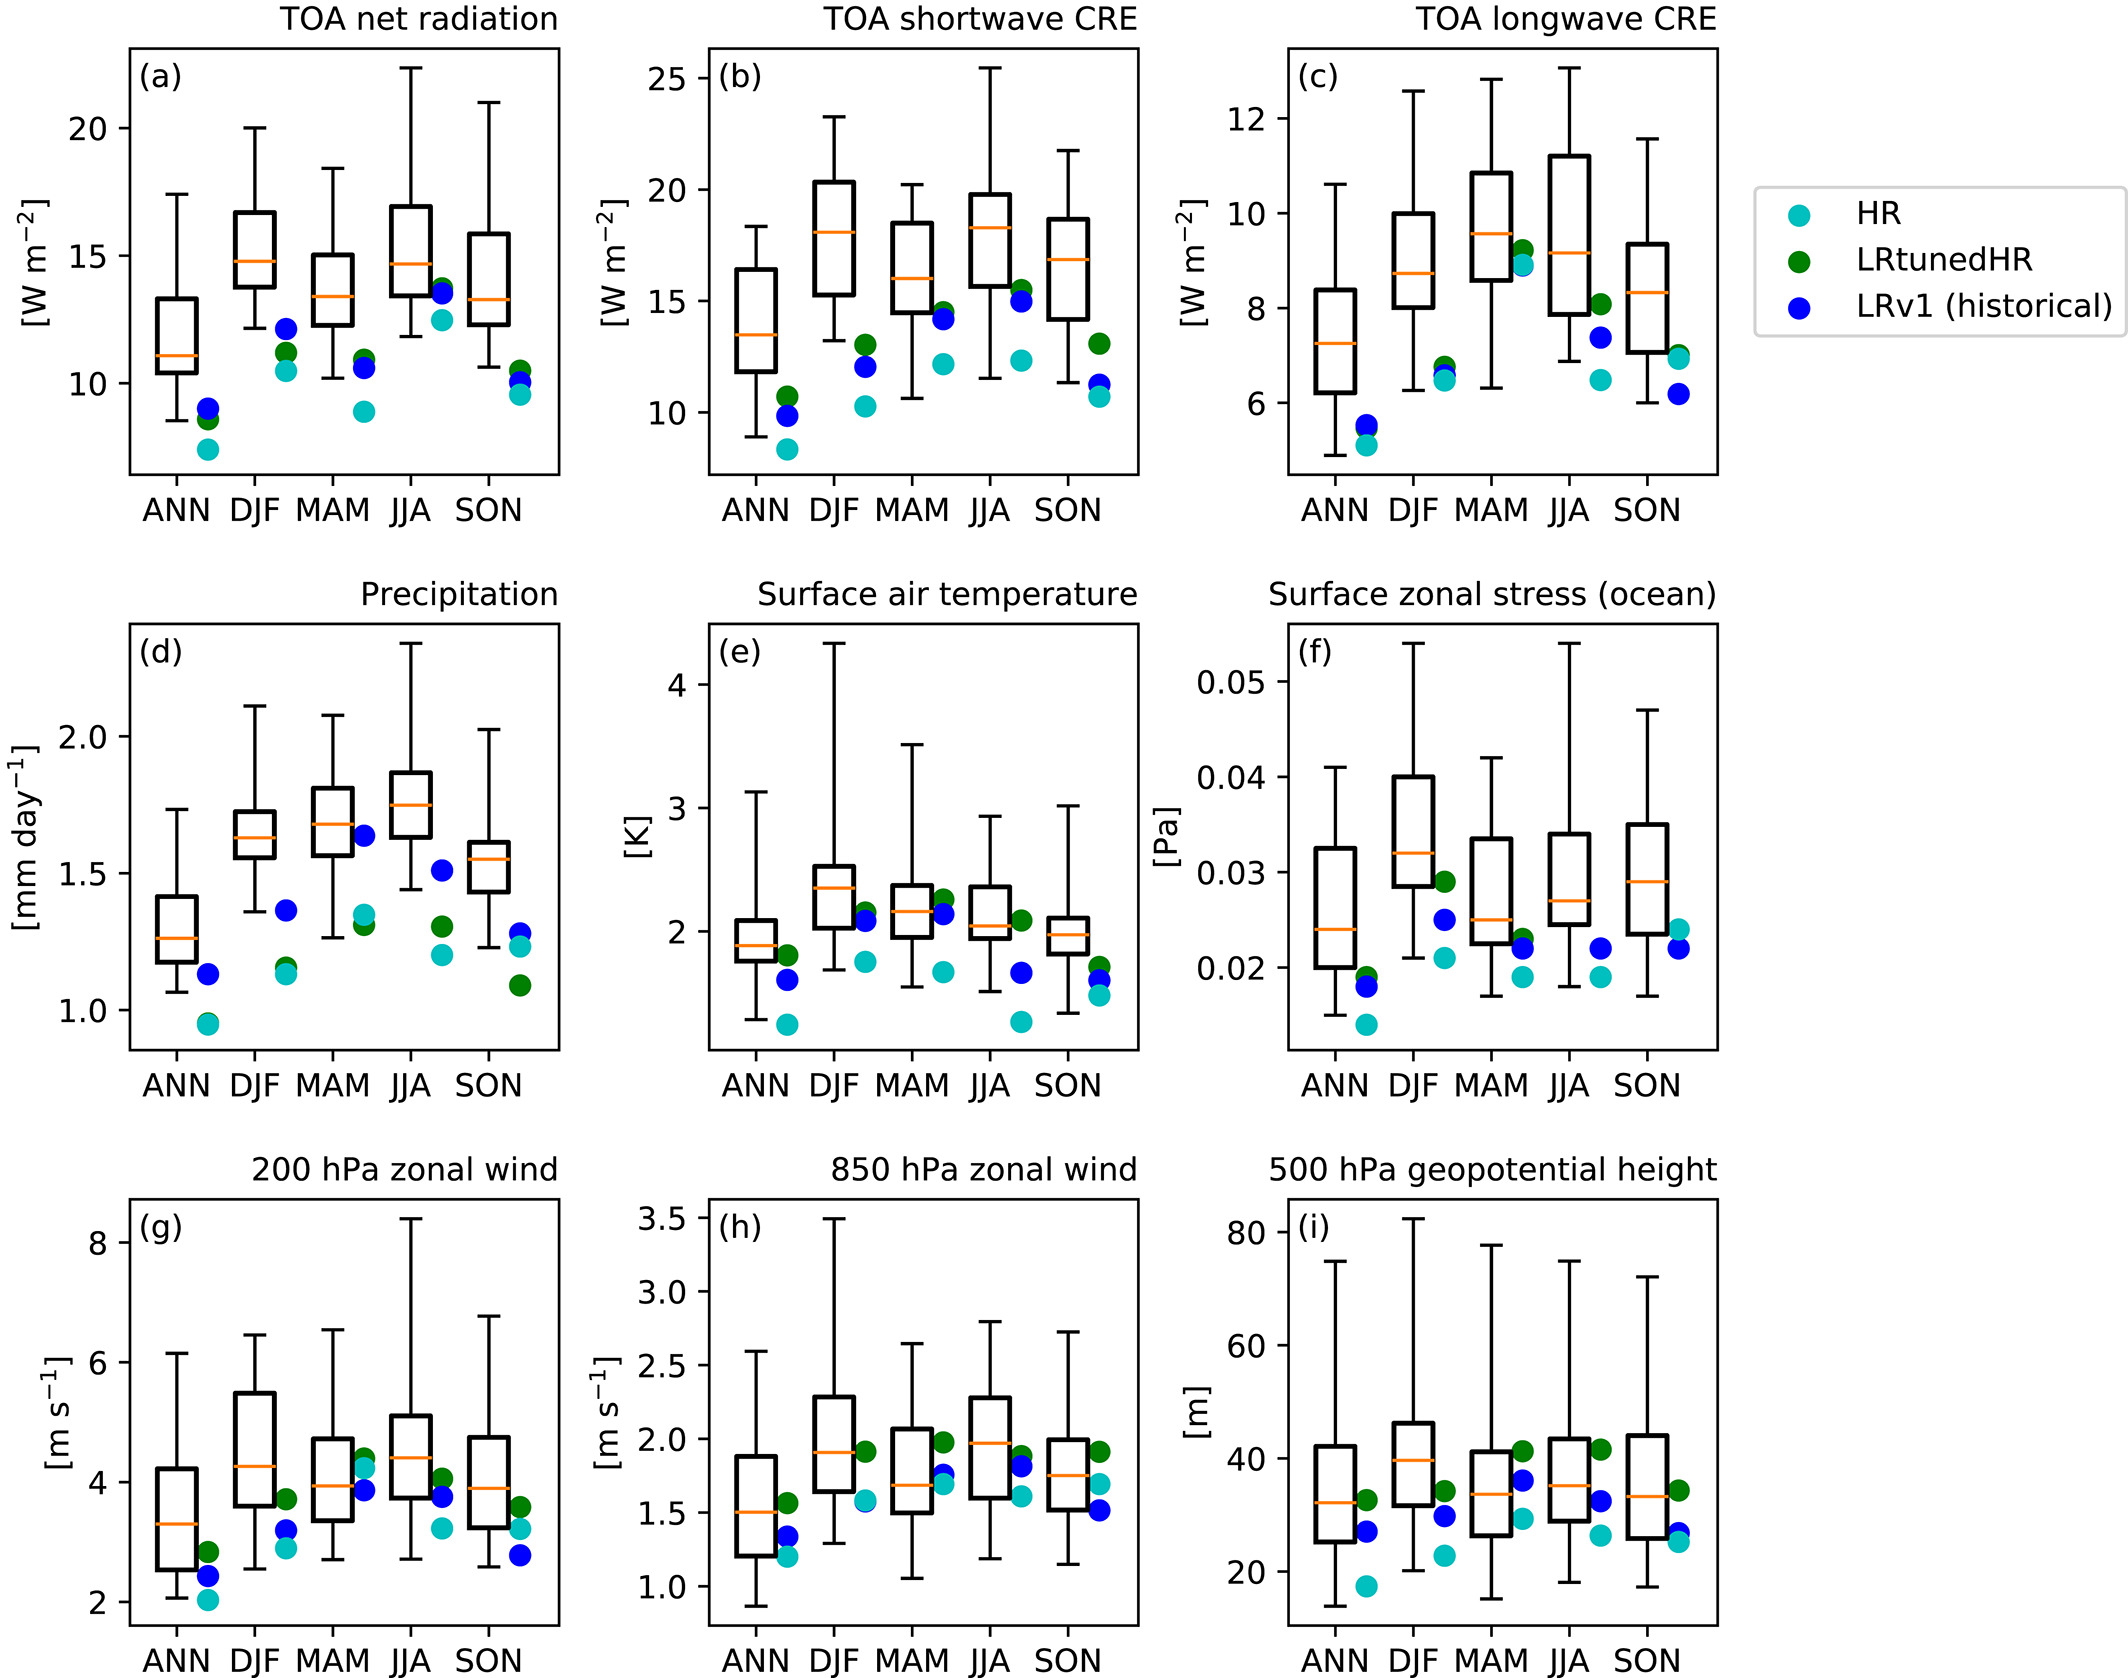
Figure 2. Comparison of root-mean-square error (RMSE; lower values are better) for HR, LRtunedHR, and LRv1 simulations (see caption of Figure 1 for description of these runs) compared against the range of CMIP5 models (red line = CMIP5 mean, box=25th to 75th percentile range, and whiskers=envelope of CMIP5 data). Fields shown include TOA net radiation (a), TOA shortwave and longwave cloud radiative effects (b, c), precipitation (d), surface air temperature over land (e), zonal wind stress over ocean (f), 200 and 850 hPa zonal wind (g, h) and 500 hPa geopotential height (i).
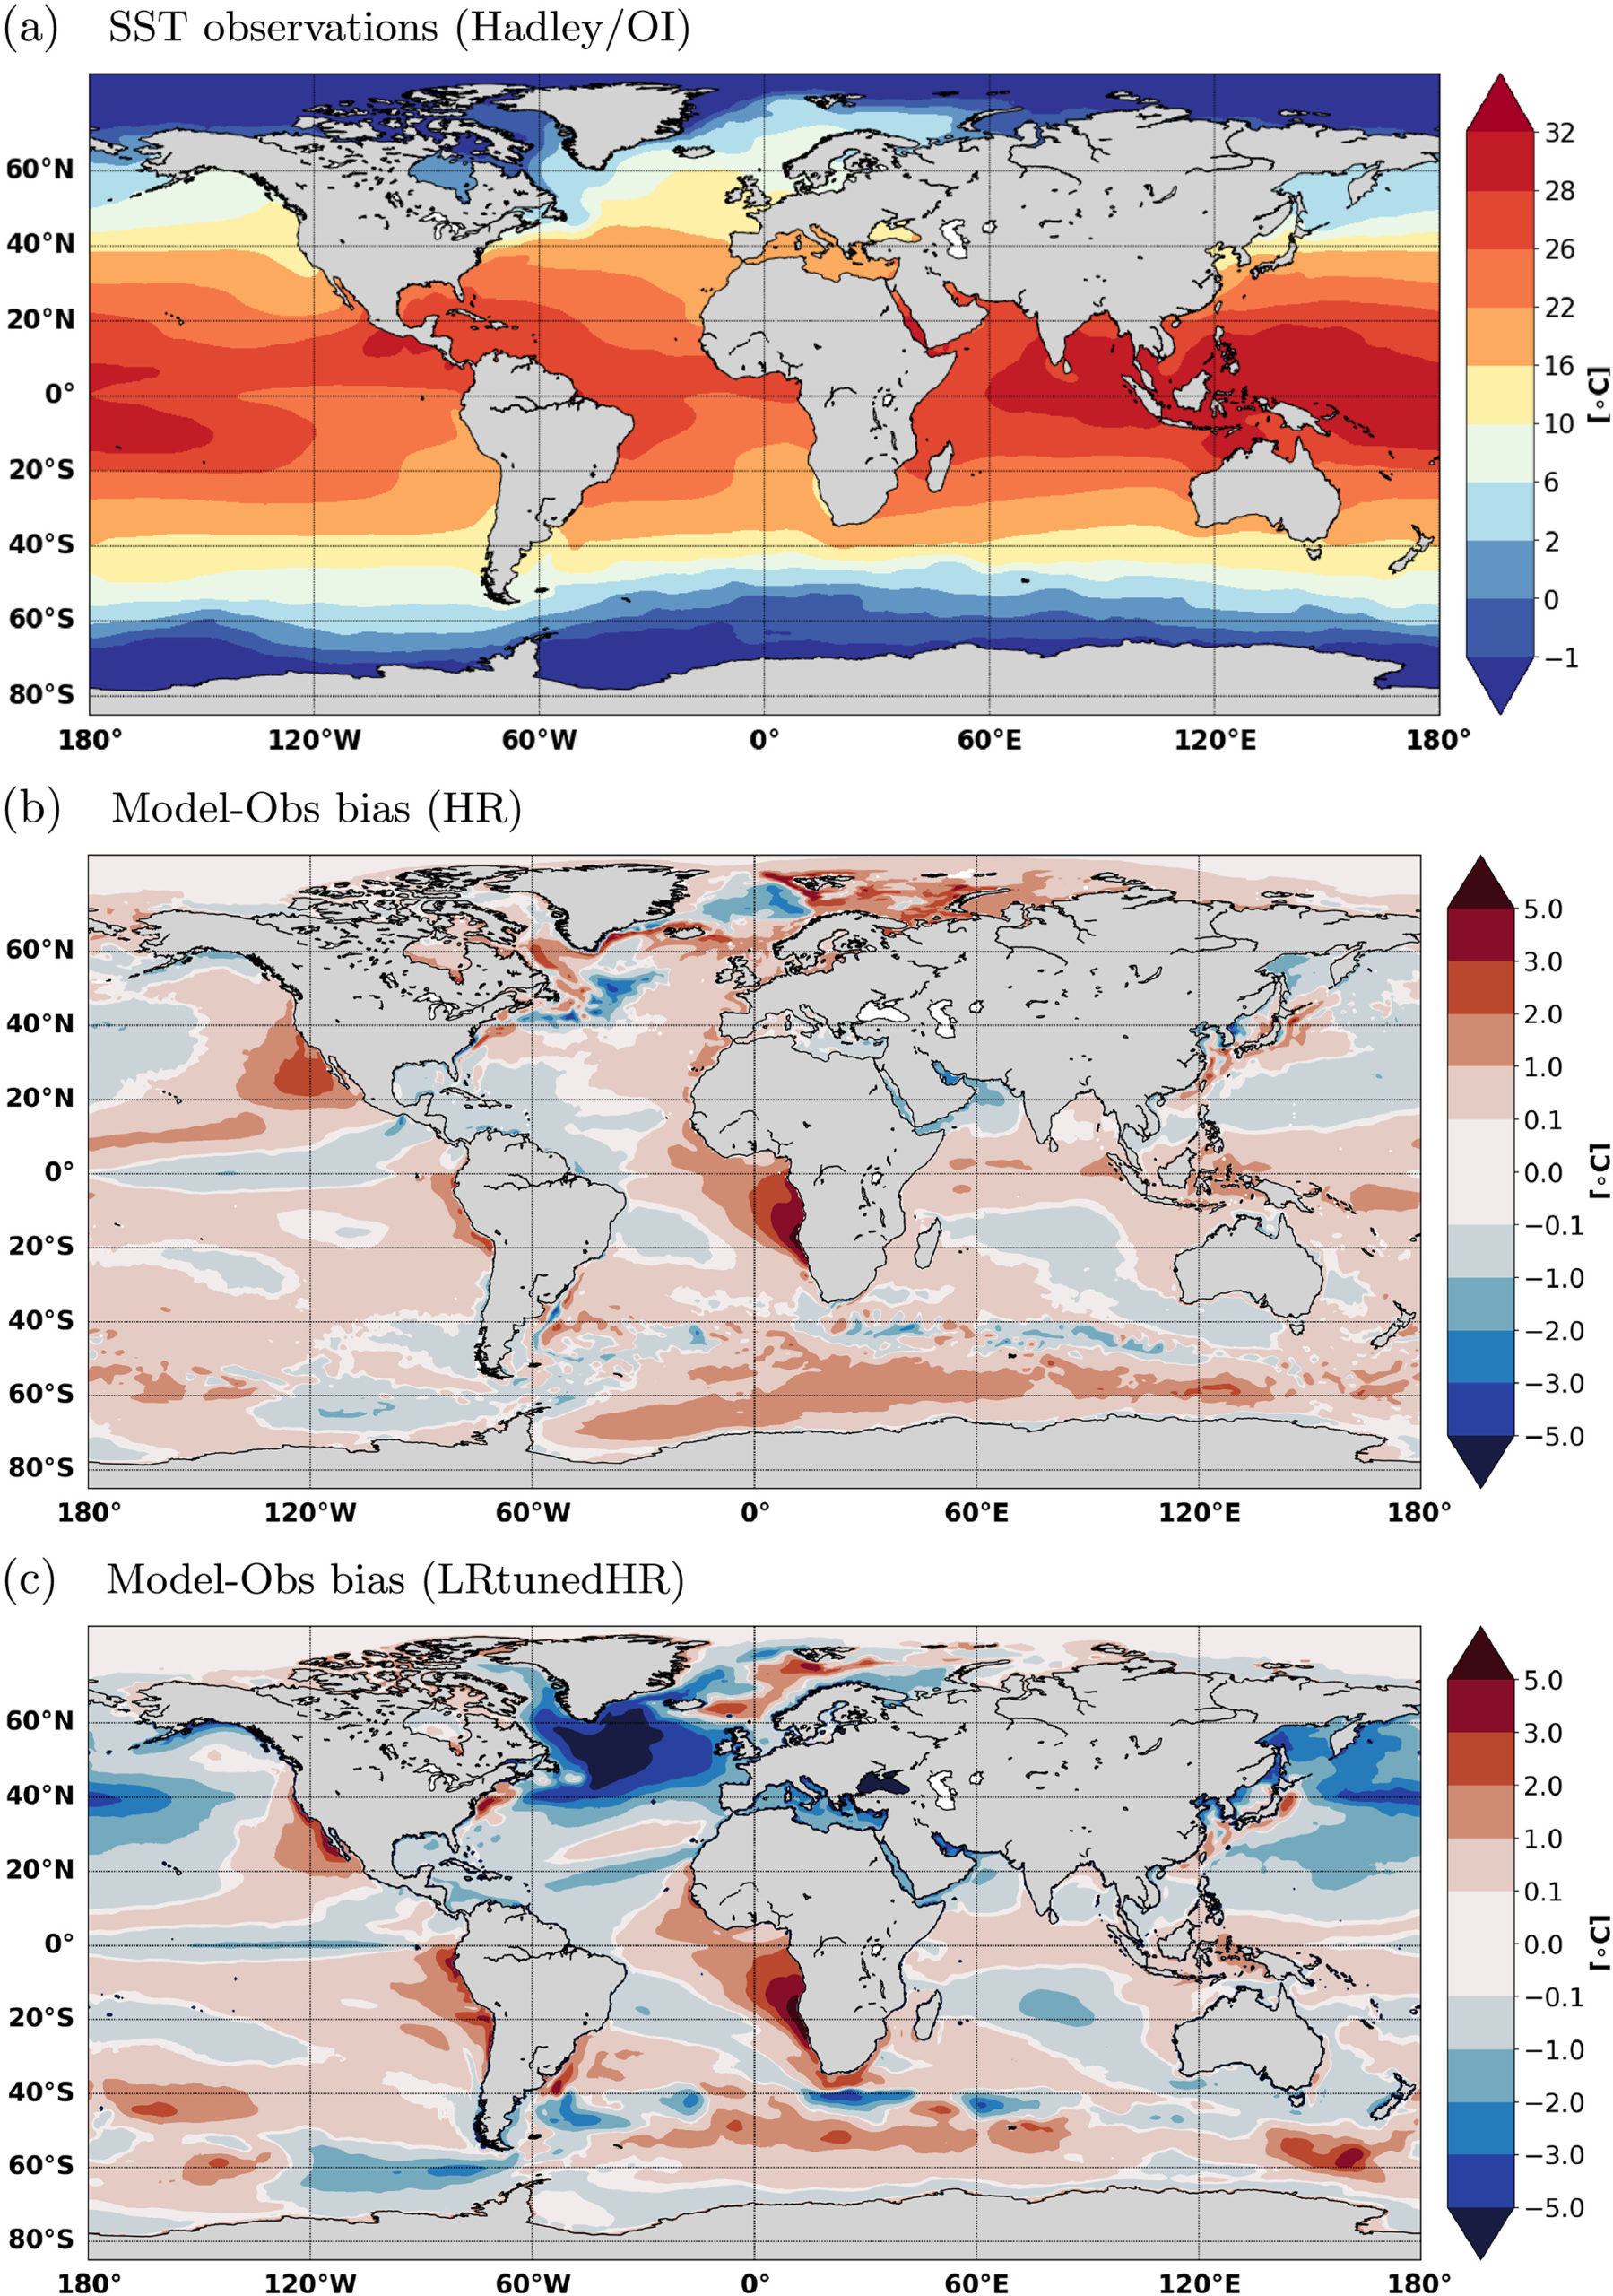
Figure 3. Annual-mean sea surface temperature (SST) from the Hadley/OI observational product (Hurrell et al., 2008) (a); HR bias with respect to observations (model‐obs) (b); and LRtunedHR bias (c).
The greatest improvement from increased resolution is in the sea surface temperature (SST) and sea ice distribution at high northern latitudes (see Fig. 3). LR simulations suffer from excessive sea ice and resulting cold bias and lack of precipitation in this region, but improved bathymetry, greater extremes in winds and currents, and strengthened ocean eddy kinetic energy at higher resolution seem to fix this bias. Coincident with this improvement is strengthening of the Atlantic Meridional Overturning Circulation, which brings the HR simulation better into agreement with observations. Unrealistic freezing of the Labrador Sea (between Greenland and North America) has been a persistent problem in lower-resolution versions of E3SM, so recognizing that mesoscale eddies, which are unresolved and poorly parameterized at standard resolution, are the cause for this bias is an important advance. While sea ice extent in wintertime is greatly improved at HR, ice thickness is too thin. This results in underpredicted summertime sea ice extent, a problem that the E3SM team is still addressing.
One disappointment in the HR run is a lack of reduction of the large bias in SST to the west of the subtropical continents (evident in Fig. 3). This bias is associated with insufficient shading of the ocean surface by stratocumulus clouds. Previous studies have consistently found increased resolution to ameliorate stratocumulus problems. E3SM scientists are currently working to understand why the HR model didn’t experience this sort of improvement.
Cloudiness was found to be remarkably insensitive to resolution change. This is a great improvement from previous climate models, which showed large and unrealistic sensitivity of clouds to model resolution. Aerosols, on the other hand, are found to have large sensitivity for reasons that can be understood physically. In particular, higher maximum wind speeds loft more dust and sea salt from the surface, increased spatial inhomogeneity increases aerosol removal by precipitation, and transition from parameterized to grid-resolved convective transport has a big effect on the vertical distribution of aerosol. It is therefore surprising that the change in global-average TOA radiation due to transitioning from pre-industrial to present-day aerosols was found to be almost identical between LR and HR runs. Interestingly, model response to imposed SST warming – a proxy for climate sensitivity to greenhouse gases – was also insensitive to switching between LR and HR implementations.
The output generated by this campaign is publicly available on ESGF, which should enable a great deal of new research. Since the publication of the HR overview paper, the team has focused on extending the HR run for an additional 100 years and performing an additional 20 yr HR simulation with extra high-frequency output. These simulations should allow for more detailed evaluation and improved understanding of model equilibration.
Publication
- Caldwell, P. M., Mametjanov, A., Tang, Q., Van Roekel, L. P., Golaz, J.‐C., Lin, W. and coauthors (2019). The DOE E3SM coupled model version 1: Description and results at high resolution. Journal of Advances in Modeling Earth Systems, 11. https://doi.org/10.1029/2019MS001870
E3SM Code
- E3SM code DOI: 10.11578/E3SM/dc.20180418.36
E3SM Data
- High-resolution data on ESGF: https://esgf-node.llnl.gov/search/e3sm/?experiment=1950-Control
- All E3SM Data on ESGF: https://esgf-node.llnl.gov/projects/e3sm/
Contact
Peter Caldwell
Lawrence Livermore National Lab
caldwell19@llnl.gov