

Quantifying the Occurrence of Record Hot Years Through Normalized Warming Trends

A new study identifies the tropics, specifically the southern-hemisphere tropics, as an area where record-breaking hot years occur more frequently. Photo by Peter Fogden on Unsplash.
Background
Numerous global warming papers have studied surface air temperature (T) trends and the occurrence of extreme hot events. Both the trends and extreme events are of global concern and they are related, as summarized in the Intergovernmental Panel on Climate Change (IPCC) Fifth Assessment Report.
It is generally understood that warming trends would enhance the occurrence of extreme events in a given region. For instance, the Arctic amplification – the larger temperature increase at Earth’s north pole compared to the tropics – (based on the raw T trends) has been emphasized in all five IPCC reports, but it can overshadow regions with smaller internal variability, where trends do not need to be as large to break records and affect the environment, ecosystem, and human well-being. These regions can be identified by trends normalized by internal variability (e.g., as represented by the standard deviations of interannual variations). Indeed, Rahmstorf and Coumou (2011) argued that the occurrence of extreme events depends on the normalized, rather than the raw, trends at a given location. However, it remains unknown whether this dependence is relevant to the comparison of extreme hot event occurrences over different regions, such as the Arctic versus the Amazon.
Science
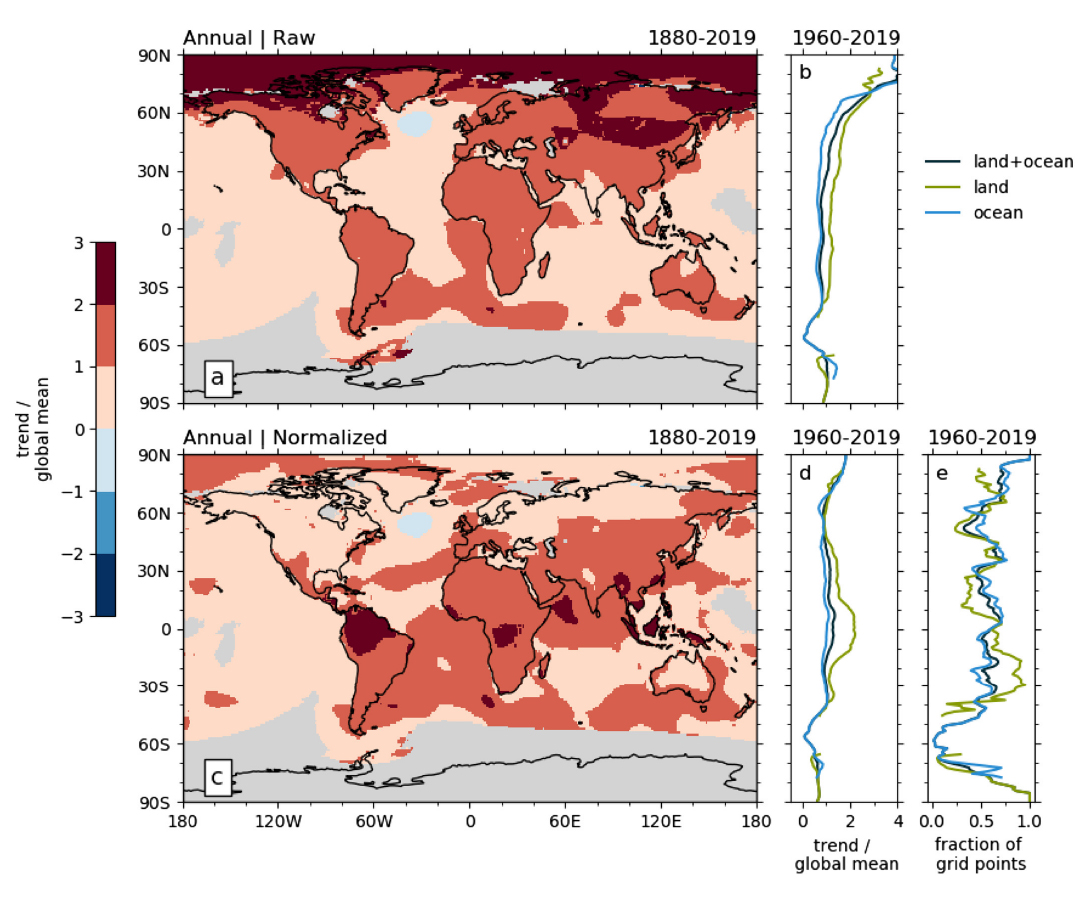
Figure 1. (a) Berkeley annual mean temperature trends from 1880 to 2019, expressed as a ratio to the global mean trend and (b) the zonal mean of this quantity for the period of 1960–2019 over land, ocean, and land + ocean. (c) and (d) Same as (a) and (b) but for normalized trends. (e) The fraction of grid boxes over land, ocean, and land + ocean across latitudes with the warmest years occurring in the last decade (2010–2019) during the 6 decades of 1960–2019. Gray shading in (a) and (c) represents grid boxes with more than 20 years of missing data. In (b), (d) and (e), grid boxes are excluded from the zonal mean if they have more than 5 years of missing data, and zonal means are not shown for latitudes with less than 10° longitude of valid data of the appropriate type (land or ocean).
The goal of this study was to address three questions: (a) How different are the spatial distributions of raw and normalized annual mean T trends from observations? (b) What are their correlations with extreme hot events, such as record-breaking annual mean T? and (c) How well do Earth system models (ESMs) participating in the Coupled Model Intercomparison Project (CMIP5 and CMIP6) perform compared with observations?
Observational Data
The scientific team primarily used the observational annual mean T data-set for 1880–2019 from the Berkeley Earth product. Additional data products were also used for uncertainty quantification, including the NASA GISS Surface Temperature Analysis (GISTEMP), the NOAA Merged Land Ocean Global Surface Temperature Analysis (NOAAGlobalTemp), and HadCRUT4. To minimize missing data for the study period, the team focused on 1960 to 2019 and used reanalysis data from the European Center for Medium-Range Weather Forecasts (ERA5).
The team analyzed these datasets to understand temperature trends, normalized trends (i.e., the original trends divided by the year-to-year temperature variability), and their relationship to the occurrence of record-breaking hot years. The linear trend of annual mean T at each grid box is computed using the least-square approach. The internal variability is computed as the standard deviation of the detrended T data. The normalized trend is simply the linear trend divided by internal variability. The raw (or normalized) trends are expressed as a ratio to the global mean trend (or normalized trend) as shown in Figure 1.
Figure 1a shows that the observed annual mean T trends from 1880 to 2019 over most of the Arctic more than double the global mean warming trend, demonstrating the existence of polar amplification. For the normalized T trends, however, the polar amplification largely disappears, and the amplification shifts to some tropical regions such as the Amazon (Figure 1c).
There are various metrics to characterize extreme hot events, and one simple metric is to compute when the warmest year occurred at each grid box. For a stationary annual time series (i.e., without any trend) for 6 decades, the probability for the warmest year to occur in the last decade is 1/6. Figure 1e shows that the fraction of grid boxes across latitudes with warmest years occurring in the last decade (2010–2019) during the 6 decades of 1960–2019 is much greater than 1/6 (i.e., 0.17) at most latitudes, because of global warming.
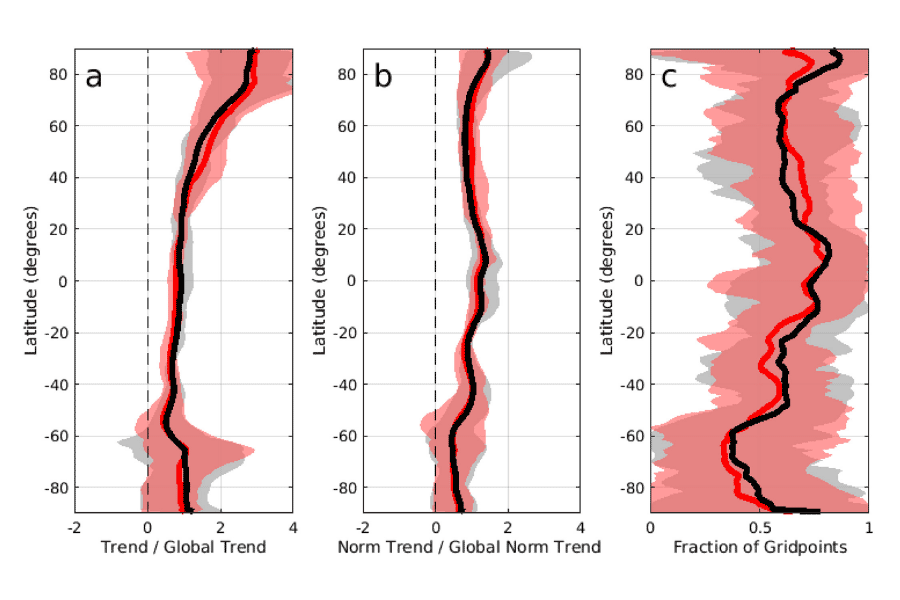
Figure 2. (a) The zonal mean of the annual temperature trends from 1955 to 2014, expressed as a ratio to the global mean trend, over land + ocean, from 17 Coupled Model Intercomparison Project (CMIP5) models (black) and 15 CMIP6 models (red) with filled envelopes showing the model spread and thick lines for the ensemble means. (b) Same as (a) but for normalized trends. (c) The fraction of grid boxes over land + ocean across latitudes with the warmest year occurring in the last decade (2005–2014) during the 6‐decade period of 1955–2014.
CMIP Models
The team used 17 CMIP5 models and 15 CMIP6 models, including E3SMv1.0 and E3SMv1.1. The CMIP5 and CMIP6 ensemble mean results are similar to each other as shown in Figure 2. These results are also similar to the observations in Figure 1, such as the strong Arctic amplification in the raw trends, much weaker Arctic amplification in the normalized trends, and high fractions occurring over different latitudes. However, while observations show a large contrast between land and ocean in normalized trends (Figure 1d) and record-breaking events (Figure 1e), these contrasts are quite small in the ensemble mean results.
In summary, based on the observational data and CMIP models, the team found that compared with the original temperature trends showing Arctic amplification, the normalized trends show a tropical amplification over land, and occurrence of record hot years in different latitudes is better correlated with normalized, rather than the original, temperature trends.
Impact
The observational data analyses and model evaluations, suggest that the normalized T trends deserve more attention to understand the occurrence of extreme hot events over different regions, and both raw and normalized trends and their relations with extreme hot events should all be included as metrics in ESM development, tuning, and evaluation.
The data analyses in this paper have also identified two hot spots where record-breaking hot years occur more frequently: Northern hemisphere ocean (vs. land) and southern hemisphere tropical land (vs. mid- and high-latitude lands), and they should receive more attention due to their significant impacts on ecosystems and the environment.
Finally, a large ensemble (e.g., with >100 members) should be used to more rigorously compare ESM results with observations. Nonetheless, this work enables the quantification of record hot year occurrence through normalized warming trends and provides new metrics for model evaluation and improvement.
Publication
- Zeng, X, J Reeves Eyre, R Dixon, and J Arevalo. 2021. “Quantifying the Occurrence of Record Hot Years Through Normalized Warming Trends.” Geophysical Research Letters 48(10). https://doi.org/10.1029/2020gl091626.
Funding
- The U.S. Department of Energy Office of Science, Biological and Environmental Research supported this research as part of the Earth System Model Development program area through the Energy Exascale Earth System Model (E3SM) project and the Improving the Interface Processes in the DOE/ACME Model project.
Contact
- Xubin Zeng, University of Arizona
Related Information
University of Arizona Press Release: https://news.arizona.edu/story/record-breaking-temperatures-more-likely-populated-tropics
World Economic Forum Article based on the U of A Press Release: https://www.weforum.org/agenda/2021/06/tropics-record-breaking-temperatures-climate-change-environment