

Projected Land Ice Contributions to 21st-Century Sea Level Rise
Several E3SM scientists contributed to a recent paper in Nature (Edwards et al., 2021) that estimates the range of future sea level rise from glaciers and ice sheets (land ice) using the most up-to-date models and emissions scenarios. The collaboration, which included 84 international researchers, projected that sea level rise from melting land ice could be halved within the next 80 years, if the aspirational target of limiting global warming to 1.5 degrees Celsius (°C) is met compared to currently pledged greenhouse gas emissions, which would result in more warming than 1.5°C. The term “land ice” includes mountain glaciers such as those in Alaska, Europe, high-mountain Asia, etc.; ice caps including those of Iceland and the Canadian Arctic; and the ice sheets in Greenland and Antarctica.
Video 1. Estimating the Sea Level Rise by Year 2100. LANL scientist, Stephen Price, talks about the research included in the Nature paper. (Credit: Stephen Price and John Patchett, LANL)
For this study, the team used a larger, more sophisticated set of climate and land ice models than ever before, combining nearly 900 simulations from 38 international groups to improve projections of future sea level rise and the associated uncertainties. The scientists used multiple glacier models, ice sheet models, climate models, and emissions scenarios to simulate the impact of land ice evolution on future sea level rise. These multi-model ensembles were combined via statistical emulation to build probabilistic projections of future sea level rise from all sources of land ice. DOE projects contributed to the work at multiple levels including selecting appropriate climate models (HiLAT), developing model parameterizations (ProSPect), and conducting high-fidelity, high-resolution ice sheet model simulations using the MALI and BISICLES ice sheet models (ProSPect) (see Videos 2 and 3 for animations of these simulations).
Video 2. Projecting Sea Level Rise Due to Antarctic Ice Sheet Melt. This movie shows the changes in ice thickness between present-day and 2100 in the SSP5-85 (high emissions) scenario included in this paper (see Figure 1’s caption below for a description of SSP5-85). Red shows regions where thinning has occurred and ice has been lost during the course of the 21st century. The regions where ice thickness increases (blue regions) are outweighed by the ice loss, which occurs particularly near the coasts. (Credit: Dan Martin, Berkeley Lab)
This work applied significantly-improved models and methods to provide comprehensive and up-to-date projections of sea level rise from land ice evolution. The estimates show that limiting global warming to 1.5°C above pre-industrial temperatures (the cyan/green SSP1-19 line in Figure 1) would cut projected 21st century sea level rise from land ice in half, relative to currently pledged emissions reductions (the black NDC line in Figure 1). For example, the median projection of cumulative rise in sea level by the year 2100 decreases from approximately 25 centimeters (cm) sea level equivalent (SLE) (center horizontal line in the black box and whiskers plot, fourth from the left; horizontal dashed line second from the bottom) to approximately 13 cm when emissions are limited (center line in the cyan/green box and whiskers plot, first from the left; bottom horizontal dashed line).
If global warming is limited to 1.5°C, Greenland ice sheet losses would be reduced by 70% and glacier losses by 50%, compared to current emissions pledges. For Antarctica, the predictions are similar across different emissions scenarios because it is currently unclear whether snow falling in the cold interior of the ice sheet will offset dynamic ice losses along Antarctica’s margins resulting from sub-ice shelf melting. However, under a “pessimistic” or “risk-averse” storyline, with much more melting than snowfall, Antarctic ice losses could be five times larger, increasing the median land ice contribution to 42 cm under current policies and pledges (third box and whisker plot from the right; second horizontal dashed line from the top), with the 95th percentile projection exceeding 50 cm even under 1.5°C warming (top whisker of the pale cyan/green box and whisker plot, sixth from the right; top horizontal dashed line). The risk-averse storylines – based on the most sensitive ice sheet and climate models – produce the highest amounts of sea level rise for the given emissions scenarios and are shown by the set of pale time-series lines and the rightmost box-and-whisker plots in Figure 1.
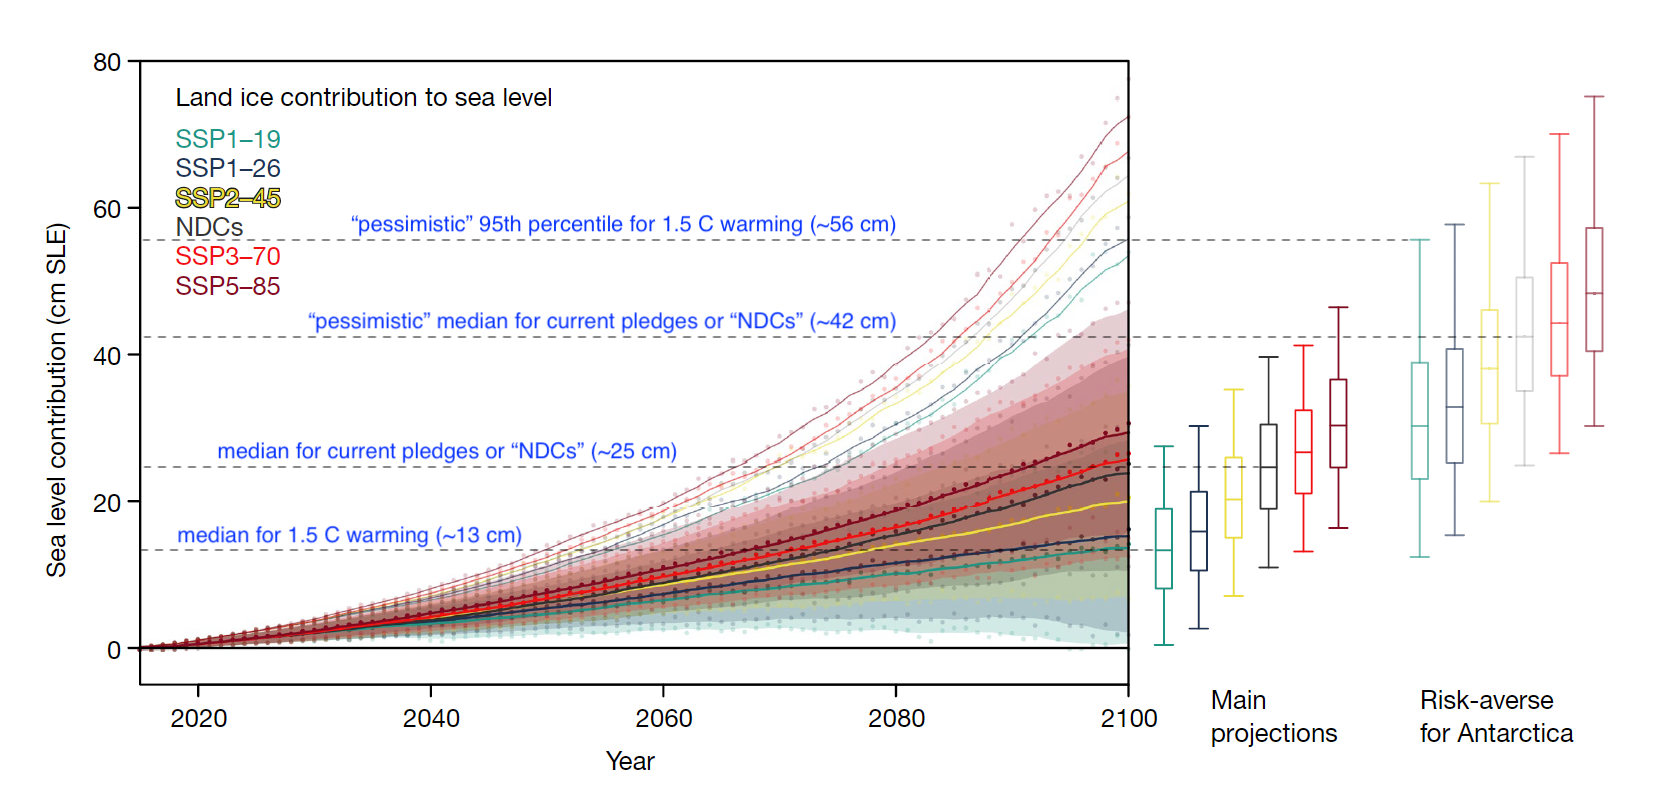
Figure 1. Projected 2015-2100 land ice contribution to sea level, in centimeters (cm) of sea level equivalent (SLE), for a range of emissions scenarios. The various SSP1, 2, 3, and 5 scenarios refer to the Shared Socioeconomic Pathways while NDC stands for nationally determined contributions reflecting current climate pledges made under the Paris Agreement. (The aspirational Paris Agreement 1.5°C goal corresponds to the SSP1-19 scenario.) Solid lines and shaded regions show median and 5-95th percentile estimates, respectively. Pale solid lines denote 95th percentiles for risk-averse projections. Box-and-whiskers indicate 5, 25, 50, 75, 95th percentiles at 2100. (Figure edited after Edwards et al., 2021)
Results from the study confirm that Antarctica remains a critical focus for reducing future uncertainty in sea level rise. The team’s high-end estimates for sea level rise from Antarctic land ice are more than twice as large as the ‘most likely’ estimate. This is largely due to substantial uncertainty in how strongly warm ocean waters will erode floating parts of the ice sheet from beneath.
In a pessimistic storyline, in which Antarctica is very sensitive to warming oceans, the scientists found there is a 5% chance of the land ice contribution to sea-level rise exceeding 56 cm in 2100 (top horizontal dashed line in Figure 1) even if warming is limited to 1.5°C. The researchers note that since the range of future sea level rise is quite large, coastal flood management must be flexible enough to account for this wide range until more observations and modeling can hone in on the most likely amount of sea level rise.
Video 3. Rate of Ice Thickness Change Across Antarctica Simulated by BISICLES for an SSP5-85 (High Emissions) Scenario. (Credit: Dan Martin, Berkeley Lab)
Video 3 shows how fast simulated Antarctic ice thickness changes (in meters of ice thickness per year) over the 90-year period from 2010 to 2100 using the BISICLES model. Light blue represents thickening ice, dark blue no change in ice thickness, red indicates slow ice loss, and yellow shows where ice is rapidly thinning. Focusing on the floating ice shelves, ice shelf thickness changes over the 90-year period are due mainly to ice melting under the shelves due to incursions of warmer ocean water below the shelves. This thinning and weakening in turn allows more ice on land behind the ice shelves to flow more quickly to the water. This is apparent in the orange regions spreading inland. As the simulation evolves, episodes of ice shelf melting are getting longer and more frequent as shown by the increased occurrence and duration of the red/orange colors of the ice shelves. By 2100, at the end of this simulation, the ice loss in the ice shelves and around the perimeter of Antarctica is quite fast in some locations. Mitigating the ice loss trend is the fact that in a warmer climate, increased snowfall occurs in the interior of Antarctica, so understanding the balance between the ocean-driven ice loss and the interior snow and ice gain is important, requires understanding of the coupled climate system, and is the focus of ongoing research.
Video 4. Antarctic Ice Sheet Response to Rapid and Sustained Removal of All Floating Ice Shelves. (Credit: Stephen Price and John Patchett, LANL)
Video 4 shows the results of a different set of experiments than those documented in the Nature paper, however the animation and experiments, where all the ice shelves are removed from Antarctica and not allowed to reform, is a useful sea level rise end-member to consider. While the animation illustrates an extreme case, this experiment allows scientists to place upper bounds on the potential rates and magnitude of sea level rise from Antarctica. This experiment used the MALI ice sheet model built by Los Alamos National Laboratory (LANL) and Sandia National Laboratories (SNL) scientists. The visualization was created by John Patchett from LANL.
Publication
- Edwards, T. L., Nowicki, S., Marzeion, B., Hock, R., Goelzer, H., Seroussi, H., et al. (2021). Projected land ice contributions to twenty-first-century sea level rise. Nature, 593(7857), 74–82. https://doi.org/10.1038/s41586-021-03302-y
Funding
- Scientific Discovery through Advanced Computing (SciDAC) and Earth System Model Development (ESMD) via the Probabilistic Sea-Level Projections from Ice Sheet and Earth System Models (ProSPect) project
- Regional & Global Model Analysis (RGMA) via the HiLAT-RASM: High-Latitude Application and Testing of Earth System Models – Phase II (HiLAT) project
Contacts
- Stephen Price, Los Alamos National Laboratory