

E3SM Pathfinding on Fugaku
Fugaku logo. No reproduction without RIKEN’s consent.
Scientists recently investigated the computational performance of E3SM’s atmospheric dynamical core on Fugaku, currently the fastest supercomputer in the world located at the RIKEN Center for Computational Science in Kobe, Japan. Their experience so far indicates that Fugaku/A64FX shows promising energy efficiency (performance/Watt) with further performance gains possible through architecture-aware optimization efforts. The investigation helped to identify gaps in the ecosystem as well as evaluate various compiler choices and programming language implementations on Fugaku.
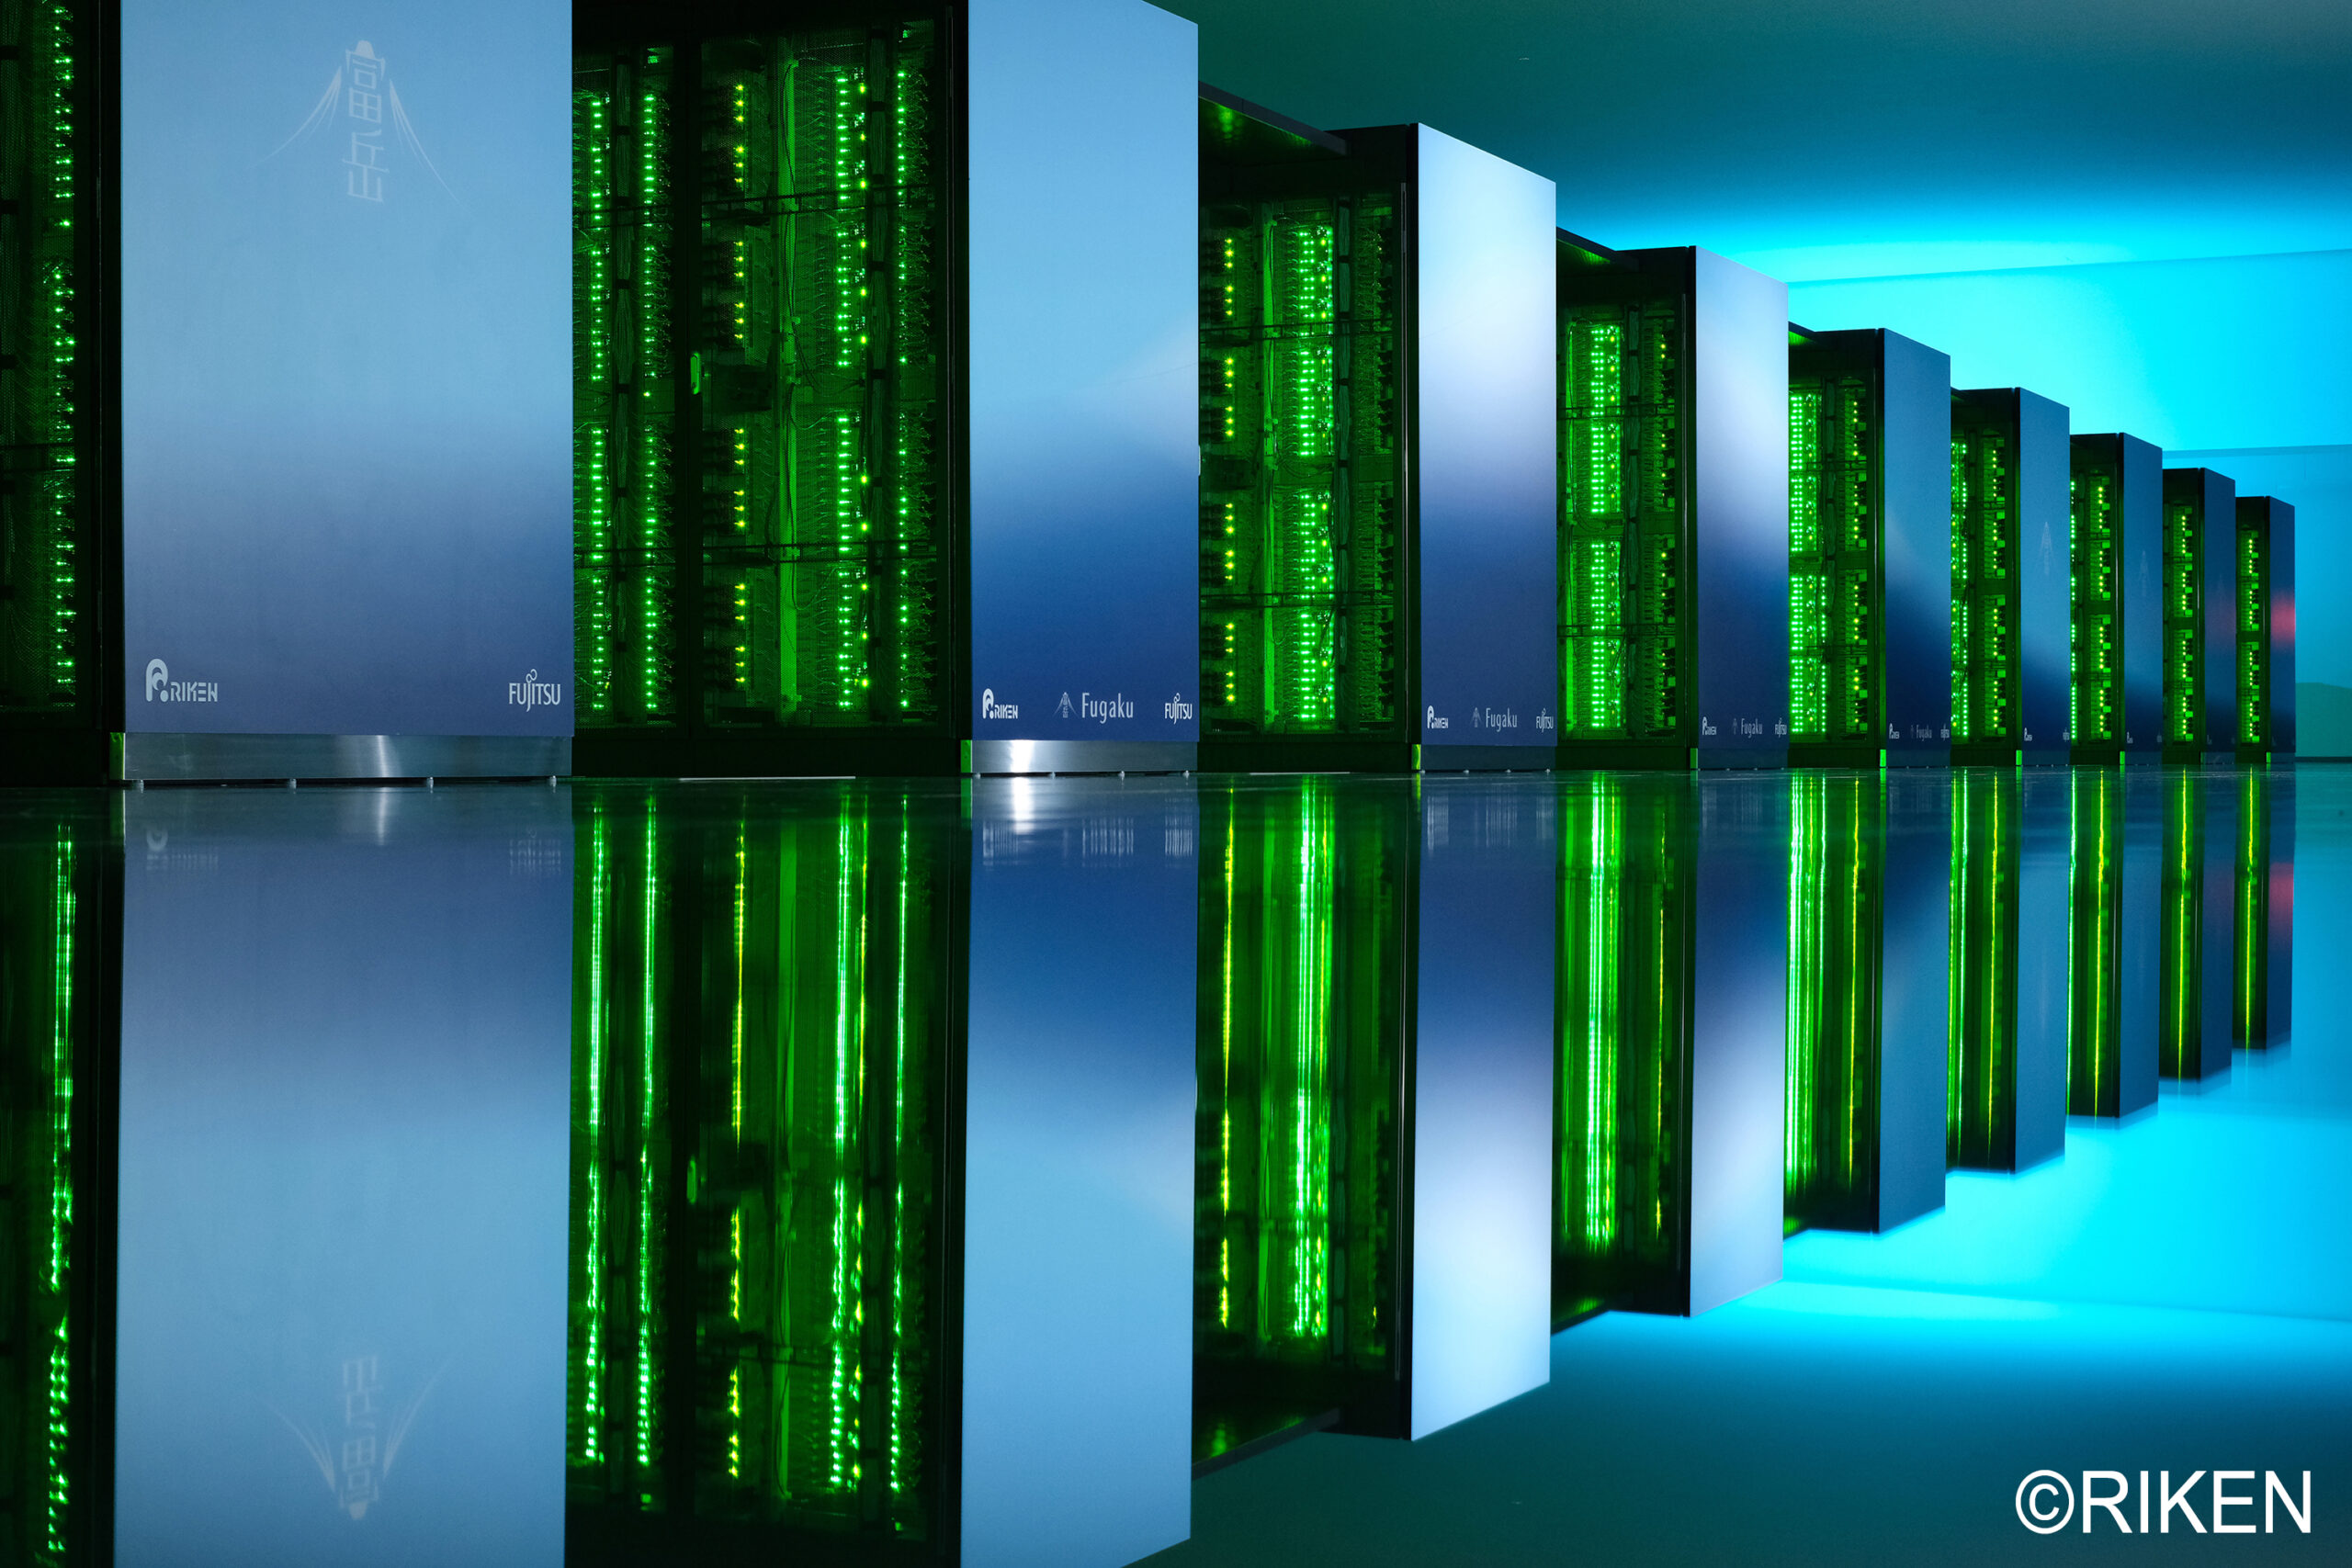
Figure 1. Fugaku supercomputer located at the RIKEN Center for Computational Science in Kobe, Japan. Image courtesy of RIKEN, no reproduction allowed without RIKEN’s consent.
Single-Node Benchmark
The benchmark investigation described here measures the on-node performance of the E3SM hydrostatic dycore “preqx”, configured as it is used in the version 1 (v1) 25 km high-resolution simulations. The benchmark measures the single-node performance as a function of workload (number of elements per node). It was first used in Bertagna et al. (2019) where the research team collected data on a variety of CPU and GPU platforms, for both the Fortran code and the C++/Kokkos version of HOMME (High-Order Methods Modeling Environment). Because the team has data going back to CPUs from 2012, this benchmark has proven to be very useful in monitoring hardware trends. E3SMv2 uses the more efficient “theta” nonhydrostatic dynamical core, but due to the similarities of the new dycore with the “preqx” dycore, the team continues to use the benchmark with “preqx” to evaluate new architectures.
Scientists typically compare performance of CPU dual socket nodes with single GPUs as a function of workload. For most hardware, this is a reasonable proxy for performance per watt, since two CPUs or a single GPU typically use 250-350 W (CPU/GPU thermal design). The latest supercomputer chip, A64FX, is an exception to this, since a single node contains one CPU and power consumption of the full node including memory and networking uses less than 200 W. To make for a fairer comparison, scientists normalized all the results by rough estimates of power consumption, leading to an efficiency metric per Watt. This per-Watt efficiency metric is shown in Figure 2. It is computed using
Ne * Nt / (prim_main_loop * num_devices * TDP)
i.e., the number of element remap timesteps per Watt where Ne is the number of spectral elements, Nt is the number of remap timesteps, prim_main_loop is the main computation loop timer, num_devices is 1 for CPU nodes or the number of GPUs per node for GPU systems, and TDP is the Thermal Design Power for the specific chip.
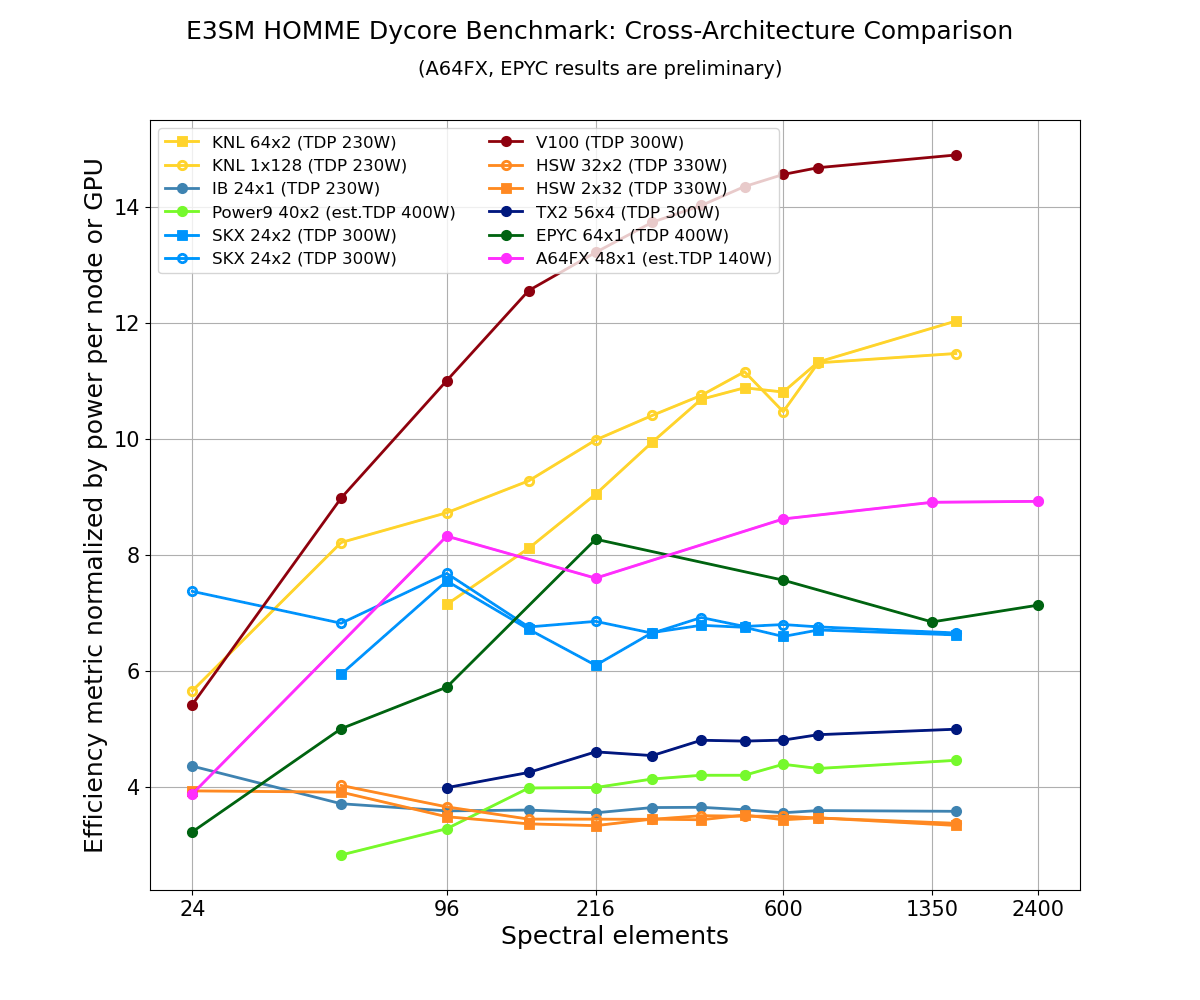
Figure 2. Plot of the efficiency metric normalized by power consumption on various hardware architectures. The legend includes a short descriptor for each architecture along with the number of parallel processes times (x) the number of threads and includes TDP in parenthesis. Specifically, the labels map as follows: KNL (Intel® Knights Landing), IB (Intel®Ivy Bridge), SKX (Intel® Skylake), V100 (NVIDIA® Volta), HSW (Intel® Haswell), A64FX (Fujitsu® A64FX), Power9 (IBM® POWER9), TX2 (Marvell®ThunderX2), EPYC (AMD® EPYC).
Figure 2 shows several interesting trends: the slow but steady performance gains of CPU-based nodes with each new generation of CPU and the CPU’s relatively uniform performance as a function of workload. The plot also shows the large performance gains made possible by GPUs, but only in the high-workload regime. When educated guesses are made for parallel scaling and related overheads, this data gives reasonable estimates allowing researchers to determine at what resolutions and node counts GPU systems will be able to outperform CPU systems. To highlight, the pink line represents the data for A64FX in boost power mode (described below) using the GNU Fortran compiler with an estimated TDP of 140 W while the red and yellow lines represent data for the Volta V100 GPU and KNL, respectively.
Plot Details:
- The preqx dycore has two implementations, namely Fortran and C++/Kokkos, configured with 72 levels and 40 tracers, which have been tested with different compilers.
- The benchmark measures the average time per complete timestep. All timesteps (dynamics, tracer, hyperviscosity) are chosen to match the proportion used in E3SMv1.
- The number of elements is varied to measure the on-node performance as a function of workload. This simulates strong scaling behavior, where the workload decreases down to one element per core in the limit of strong scaling.
- The benchmark is thus a good representation of the v1 dycore, but does not include inter-node Message Passing Interface (MPI) costs and other overheads. It therefore represents an upper bound on the dycore performance.
Compiler Evaluation
The team performed detailed experiments using preqx (Fortran) and preqx_kokkos (C++). Table 1 shows the ‘prim_main_loop’ timer data for each corresponding experiment while running 48 processes in parallel on a single node that communicates with each other using the MPI.

Table 1. Timer data for the detailed benchmark experiments run by the team. The compilers used in these experiments were GNU 10.2.0 and Fujitsu 4.5.0 (tcsds-1.2.31). Within the column labels, the prefix GFortran refers to the benchmark built with GNU Fortran (preqx), ‘FujitsuFortran’ refers to the version built with Fujitsu Fortran compiler, and G++ refers to the GNU C++(preqx_kokkos) version of the benchmark. The suffixes ‘O3’, ‘Ofast’ and ‘Kfast’ refer to various compiler optimization levels. For these sets of experiments, researchers have enabled the boost mode (2.2 GHz) on Fugaku compute nodes. Using the GNU compilers, the Fortran version outperformed the C++ version. Furthermore, as the table shows, GNU Fortran is twice as fast as Fujitsu Fortran for this workload.
Power and Performance Tradeoffs
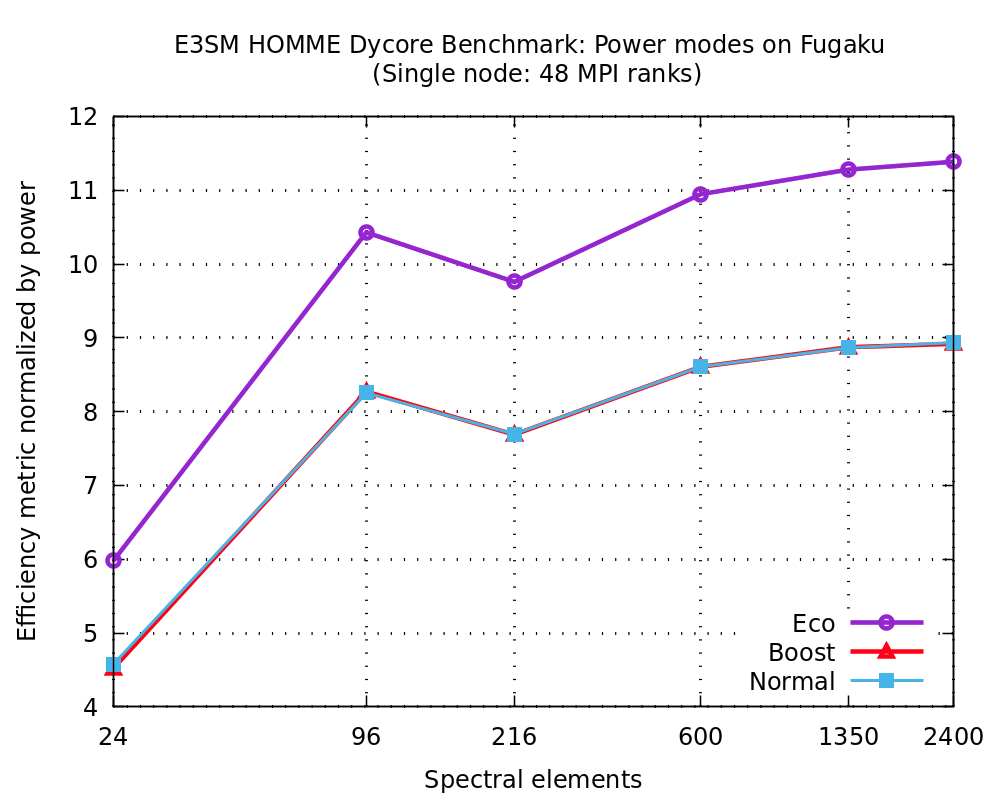
Figure 3. Efficiency metric as defined above normalized by the measured power for benchmark execution (instead of TDP) on the Fugaku compute node. The labels refer to the Eco, Boost and Normal power modes, respectively.
Fugaku has the provision for power control during job execution to reduce power consumption and provides a mechanism for user-specified power control knobs for setting the CPU frequency etc. Furthermore, there is a user-accessible programming interface to measure real-time power consumption for a specified compute node during an application execution. The team investigated the tradeoffs associated with running their workload while setting the CPU in normal mode (2 GHz), boost mode (2.2 GHz) and eco mode (2 GHz/eco_state=2), respectively. Using the benchmark built with GNU Fortran compiler, Figure 3 shows the aforementioned efficiency metric normalized by the measured power on the compute node. The eco mode configuration provided the best performance/power tradeoff while normal and boost modes overlap.
User Experience and Community Interactions
The team was able to experiment with the software ecosystem and A64FX hardware on a couple of testbeds at Sandia National Laboratory and Oak Ridge National Laboratory. This preliminary work facilitated optimization of compiler flags etc. and pointed to the performance disparity between compilers for E3SM’s workload.
One of the first obstacles encountered on Fugaku was the lack of CMake support for Fujitsu compilers and math libraries. The team communicated the issue to Kitware, ARM and Fujitsu. An initial workaround and support was added by Kitware which has since been superseded by official support from Fujitsu. These developments have benefited all CMake based applications and libraries on Fugaku.
Furthermore, the team had fruitful interactions with the Fugaku Helpdesk on multiple topics including support for GNU compilers with Fujitsu MPI which was added last month. The team’s initial testbed results indicated that GNU compilers outperformed Fujitsu compilers for E3SM’s workload. Recently, the availability of Fujitsu MPI support for GNU compilers has finally allowed the team to confirm this finding on Fugaku as well.
Pathfinding activities such as these are informative in understanding the impact of new technologies (in this instance, high bandwidth memory and high-performance/low-power CPU architecture) and shed light on required architecture-aware optimization efforts. Computing history indicates that any architectural feature deemed valuable usually propagates to other vendor roadmaps and products. Hence, early evaluation data aids in planning for performance portable design to ensure good performance across diverse architectures.
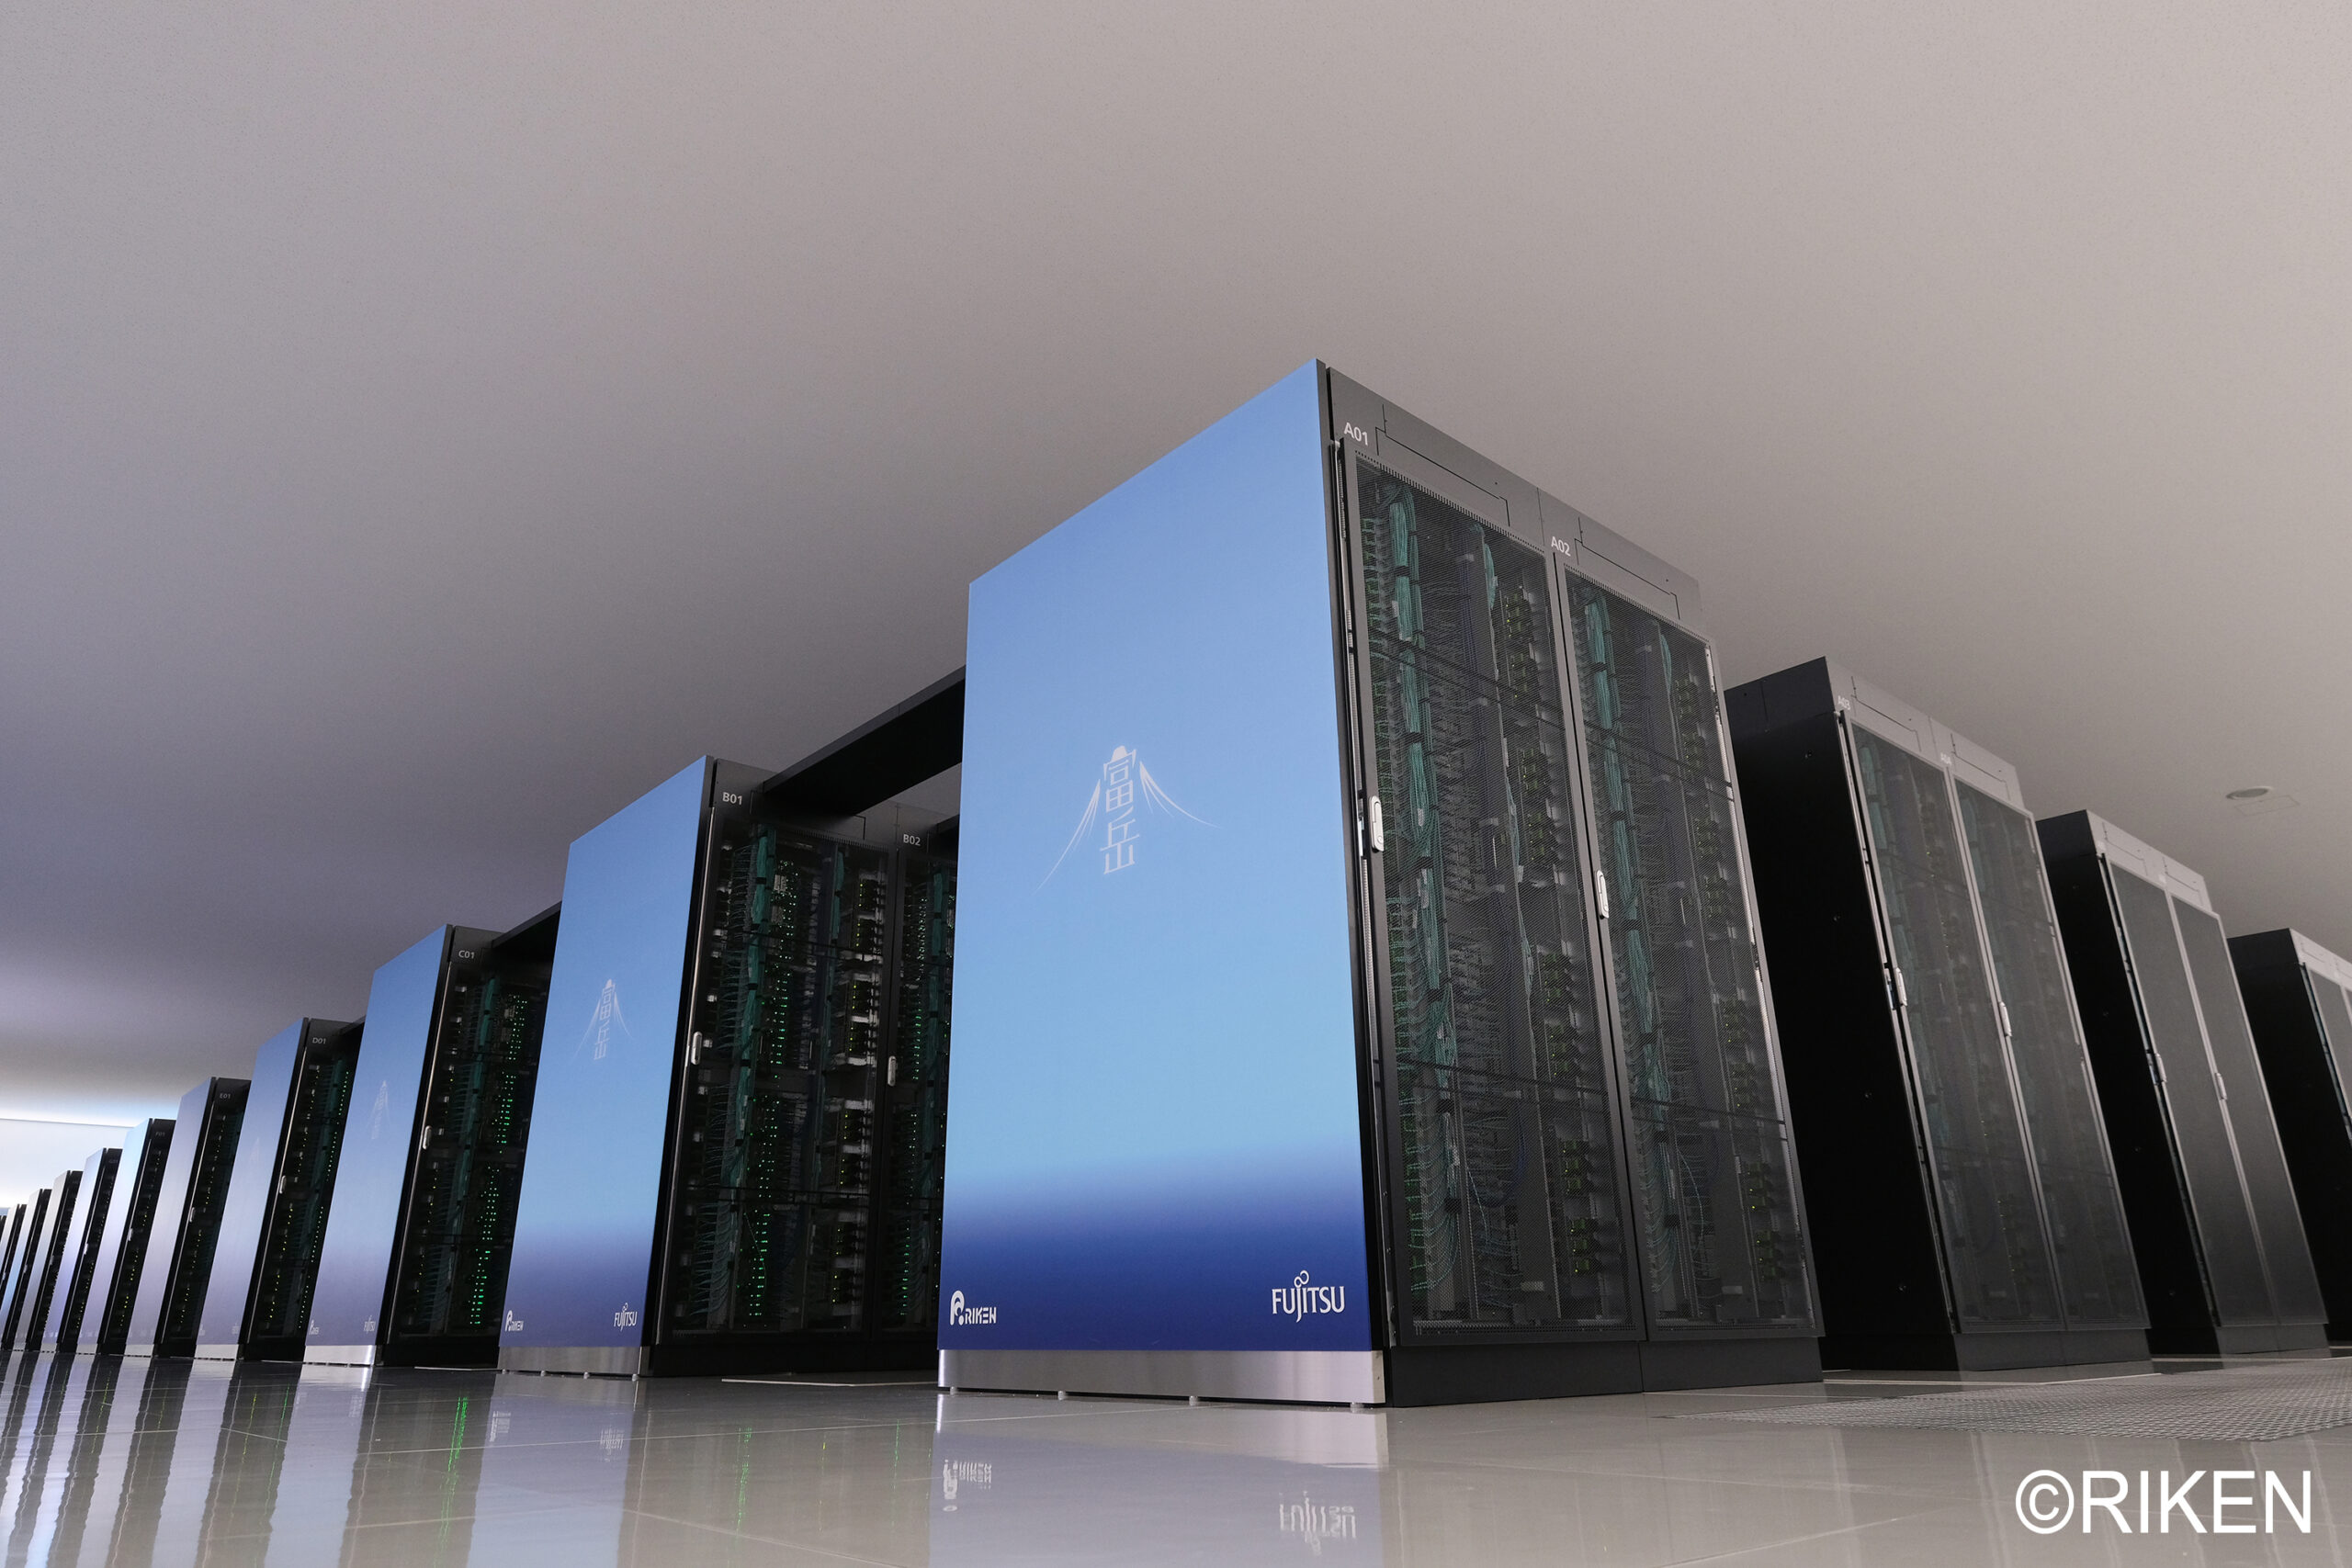
Figure 4. Another view of the Fugaku supercomputer which is currently the fastest supercomputer in the world. Image courtesy of RIKEN, no reproduction allowed without RIKEN’s consent.
Acknowledgements
- This research used computational resources of the Fugaku supercomputer provided by the RIKEN Center for Computational Science as part of the DOE (USA) – MEXT (Japan) collaboration.
- This research used resources of the Oak Ridge Leadership Computing Facility, which is a DOE Office of Science User Facility supported under Contract DE-AC05-00OR22725.
- This research was supported by the Exascale Computing Project (17-SC-20-SC), a collaborative effort of the U.S. Department of Energy Office of Science and the National Nuclear Security Administration.
Contacts
- Sarat Sreepathi, Oak Ridge National Laboratory
- Oksana Guba, Sandia National Laboratory
- Mark Taylor, Sandia National Laboratory