

E3SM Effort on COVID-19
In an effort to prevent the spread of COVID-19, people have altered the way they live, work, and travel. These changes have resulted in changes in energy consumption and reductions in emissions. For example, global CO2 emissions decreased by 17% by early April 2020 compared to the same time in 2019 (Le Quéré et al., 2020). However, the impact of those emissions reductions on climate is still unknown. E3SM, along with several other international Earth System Models, plans to quantify the effect of COVID-related emissions reductions on climate. To do this, E3SM and the other international teams will compare simulations with COVID-related emissions reductions and simulations without these reductions. The scientific team will examine the effects on temperature, precipitation, and other variables both globally and locally. The effort is just starting but scientists are planning to have results in the fall.
The key reference for this work is the Le Quéré et al., 2020 paper which defines a confinement index (CI) and includes the figures below. (The figure numbers from the Le Quéré et al. paper have been preserved.)
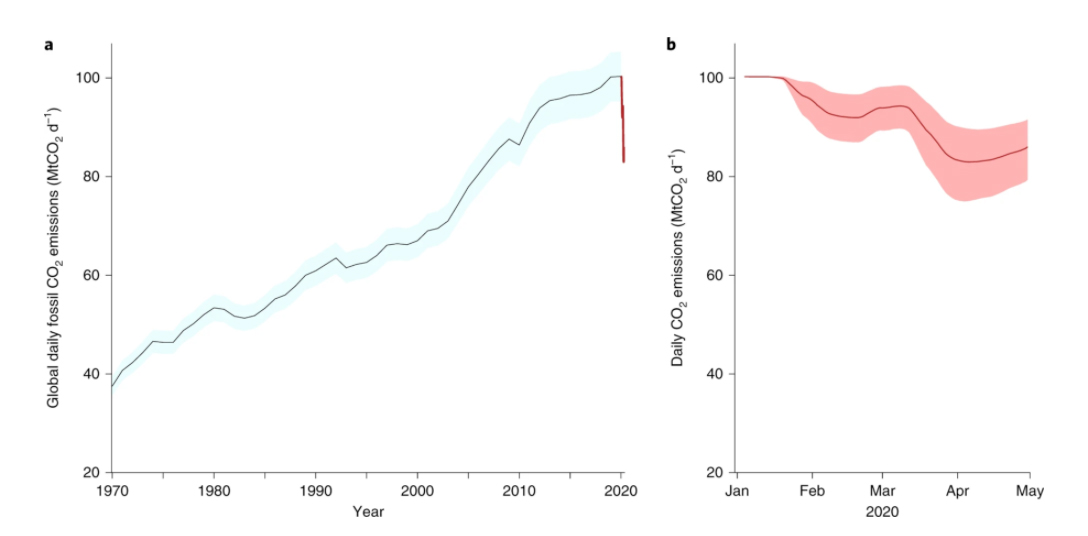
From Le Quéré et al., 2020, Figure 3. Global daily fossil CO2 emissions (MtCO2 d−1). a, Annual mean daily emissions in the period 1970–2019 (black line), updated from the Global Carbon Project (Methods), with uncertainty of ±5% (±1σ; grey [light blue] shading). The red line shows the daily emissions up to end of April 2020 estimated here. b, Daily CO2 emissions in 2020 (red line, as in a) based on the confinement index (CI) and corresponding change in activity for each CI level and the uncertainty (red shading). Daily emissions in 2020 are smoothed with a 7-d box filter to account for the transition between confinement levels.
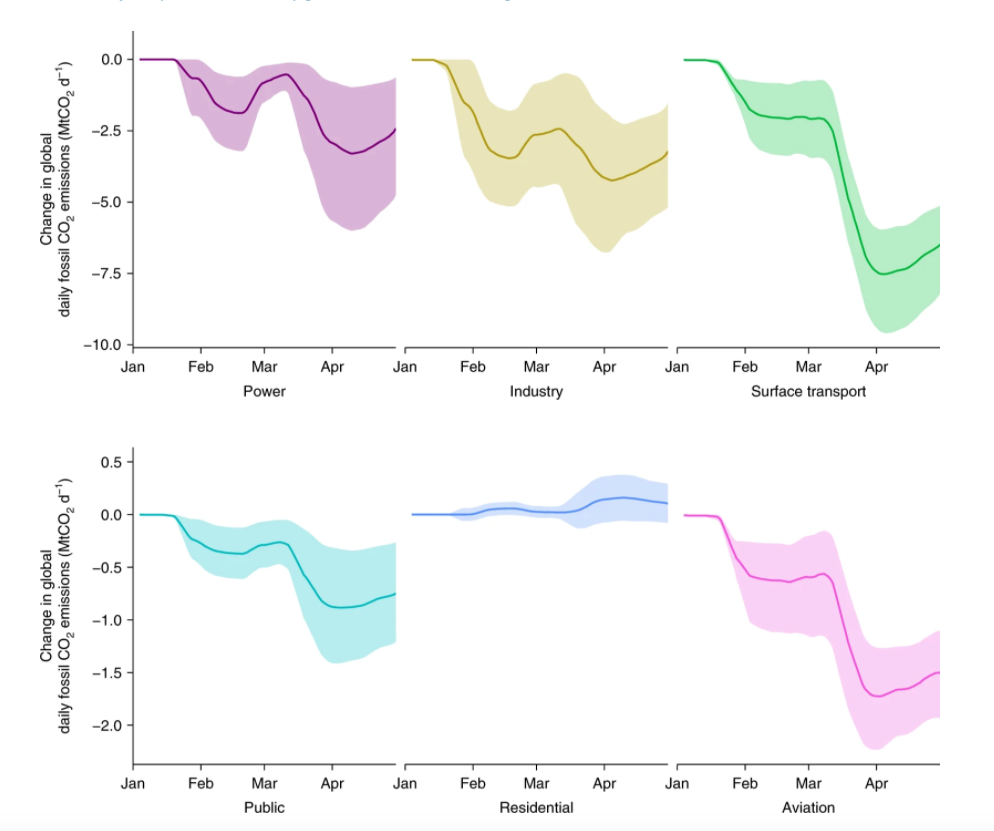
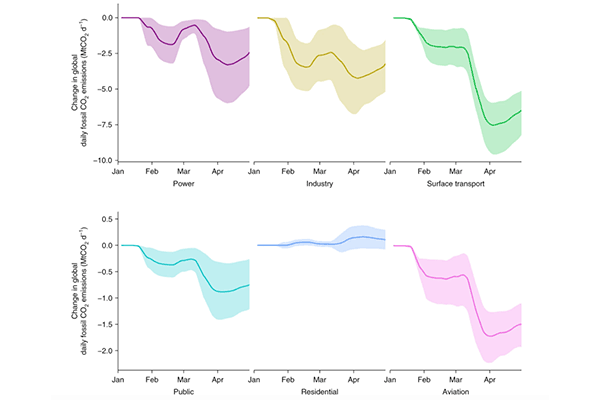
From Le Quéré et al., 2020, Figure 4. Change in global daily fossil CO2 emissions by sector (MtCO2 d−1). The uncertainty ranges represent the full range of our estimates. Changes are relative to annual mean daily emissions from those sectors in 2019 (Methods). Daily emissions are smoothed with a 7-d box filter to account for the transition between confinement levels. Note the different ranges on the y axes in the upper and lower panels.
References
- Le Quéré, C., Jackson, R. B., Jones, M. W., Smith, A. J. P., Abernethy, S., Andrew, R. M., et al. (2020). Temporary reduction in daily global CO 2 emissions during the COVID-19 forced confinement. Nature Climate Change, 10(7), 647–653. https://doi.org/10.1038/s41558-020-0797-x
Funding
- DOE’s Office of Science, Biological and Environmental Research (BER), Earth System Model Development (ESMD), E3SM Project
Contact
- Kate Calvin, Pacific Northwest National Laboratory