

Do Models Produce Consistently Different Outcomes Between Scenarios with Different Land Use Change Patterns?

Figure 1. A multi-model analysis finds no robust differences in several climate extreme metrics between scenarios that only differ in their land-use patterns. (Image by Tom Fisk | Pexels)
This study is testing the assumption that different future socio-economic development patterns, which result in different land-use changes, can be paired with different future climate outcomes for risk assessments in a multi-model framework.
The Science
Researchers use integrated analyses that associate future trends in socio-economic factors with future trends in climatic impact drivers when characterizing future risks from climate change effects. These assessments rely on Shared Socioeconomic Pathways (SSPs) and Representative Concentration Pathways (RCPs), developed from the SSPs. They operate with SSPs and RCPs decoupled; multiple SSPs can produce the same overall RCP. A new study tests one assumption that supports decoupling. Does land use alone produce significant changes between scenarios? The team took a multi-model perspective, asking if the changes are not only statistically significant within a model, but also robust across models.
The Impact
For several impact-relevant extreme metrics, land use change (LUC, Fig. 1) does not produce differences that are robust across models. This confirms the assumption that a given RCP outcome from climate models can be paired with different SSPs’ socioeconomic factors in a risk assessment framework. Regional forcers like land use do not drive climate outcomes in a way that undermines the basic SSP-RCP matrix framework. Thus, the current integrated analysis framework for risk assessment is valid for testing the relevance of socio-economic factors to the overall risks from climate change.
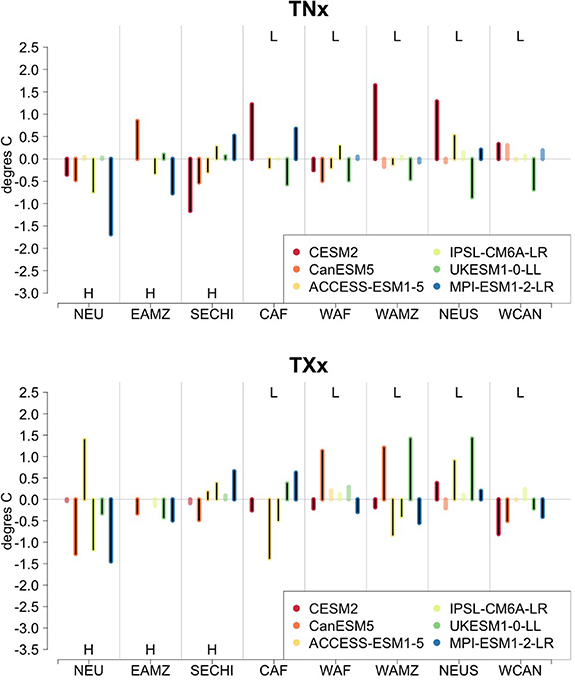
Figure 2. The size and significance of the difference in the 20-year return level of the hottest night and day of the year (TNx and TXx, respectively) for each of eight regions along the x-axis and each of the six models (one colored bar for each model in each region). Darker colors and a black line running along the length of the bar indicate statistically significant differences (5% level). Lighter colors indicate a non-significant change. The behavior is similar for indices characterizing coldest days and nights. Indices related to precipitation intensity show very few significant differences across regions/models. H or L indicates that the region experiences afforestation (H) or deforestation (L) and their position suggests the expected sign of the change. The regions depicted along the x axis are: Northern Eurasia (NEU), Eastern Amazon (EAMZ), Southeast China (SECHI), Central Africa (CAF), West Africa (WAF), West Amazon (WAMZ), Northeast USA (NEUS), Western Canada (WCAN).
Summary
The scenario development community has created the SSPs, which coherently project the human factors of global change. These are used to drive model projections of climate change under different pathways, characterized by their radiative forcing strength and categorized as RCPs. Applying mitigation policies to SSPs with different emissions and land use patterns can lead to the same RCP. What changes is not the overall radiative forcing, but its composition. The assumption is that overall, regional differences are drowned by the overall strength of the forcing and SSPs are generally decoupled from RCPs. This is important because the impact community takes climate model outcomes under an RCP and pairs them with the human factors of different SSPs to test if the SSP makes a difference in the assessment of risk. This would be a flawed approach if a given RCP were consistent only with a given SSP.
Researchers analyzed 20-year return levels of six metrics of extremes under two scenarios that only differ by LUC patterns: SSP3-7.0 and a variant that swaps in LUC from SSP1-2.6. Scientists analyzed output from six Earth system models ran under a scenario characterized by strong land use change along the 21st century and a scenario variant that only differs in afforestation/deforestation patterns. They computed six extreme metrics (cold and hot day/night temperatures, intense daily precipitation) and determined if their statistics show significant (within a model) and robust (across models) differences by the end of the century in areas where land use change differs significantly between scenarios (see Fig. 2).
Changes in precipitation extremes between the two scenarios are still overwhelmed by the noise of internal variability in the great majority of models/regions. Temperature extremes show a significant differential between the two scenarios for some model-location combinations, but not in a consistent and robust way for any employed metrics (Fig. 2). Thus, in this multi-model framework, land use alone should not be a concern when considering scenarios where it is the only difference. In short, our results support the pairing of different SSPs to the compatible RCPs based only on the global radiative forcing which is predominantly determined by well-mixed greenhouse gas emissions.
Publication
- Tebaldi, Claudia, Michael Wehner, Ruby Leung, and David Lawrence. 2023. “Is Land Use Producing Robust Signals In Future Projections From Earth System Models, All Else Being Equal?”. Environmental Research Letters 18 (8). IOP Publishing: 084009. doi:10.1088/1748-9326/ace3da.
Funding
- This work was supported by the Energy Exascale Earth System Model (E3SM) of the Earth System Model Development program area and the Calibrated and Systematic Characterization, Attribution, and Detection of Extremes (CASCADE) and Water Cycle and Climate Extremes Modeling (WACCEM) projects of the Regional and Global Model Analysis program area of the Department of Energy, Office of Science, Biological and Environmental Research program.
Contact
- L. Ruby Leung, Pacific Northwest National Laboratory
This article is a part of the E3SM “Floating Points” Newsletter, to read the full Newsletter check: