

A New Color Map for Visualization and Analysis of Sea Ice Motion
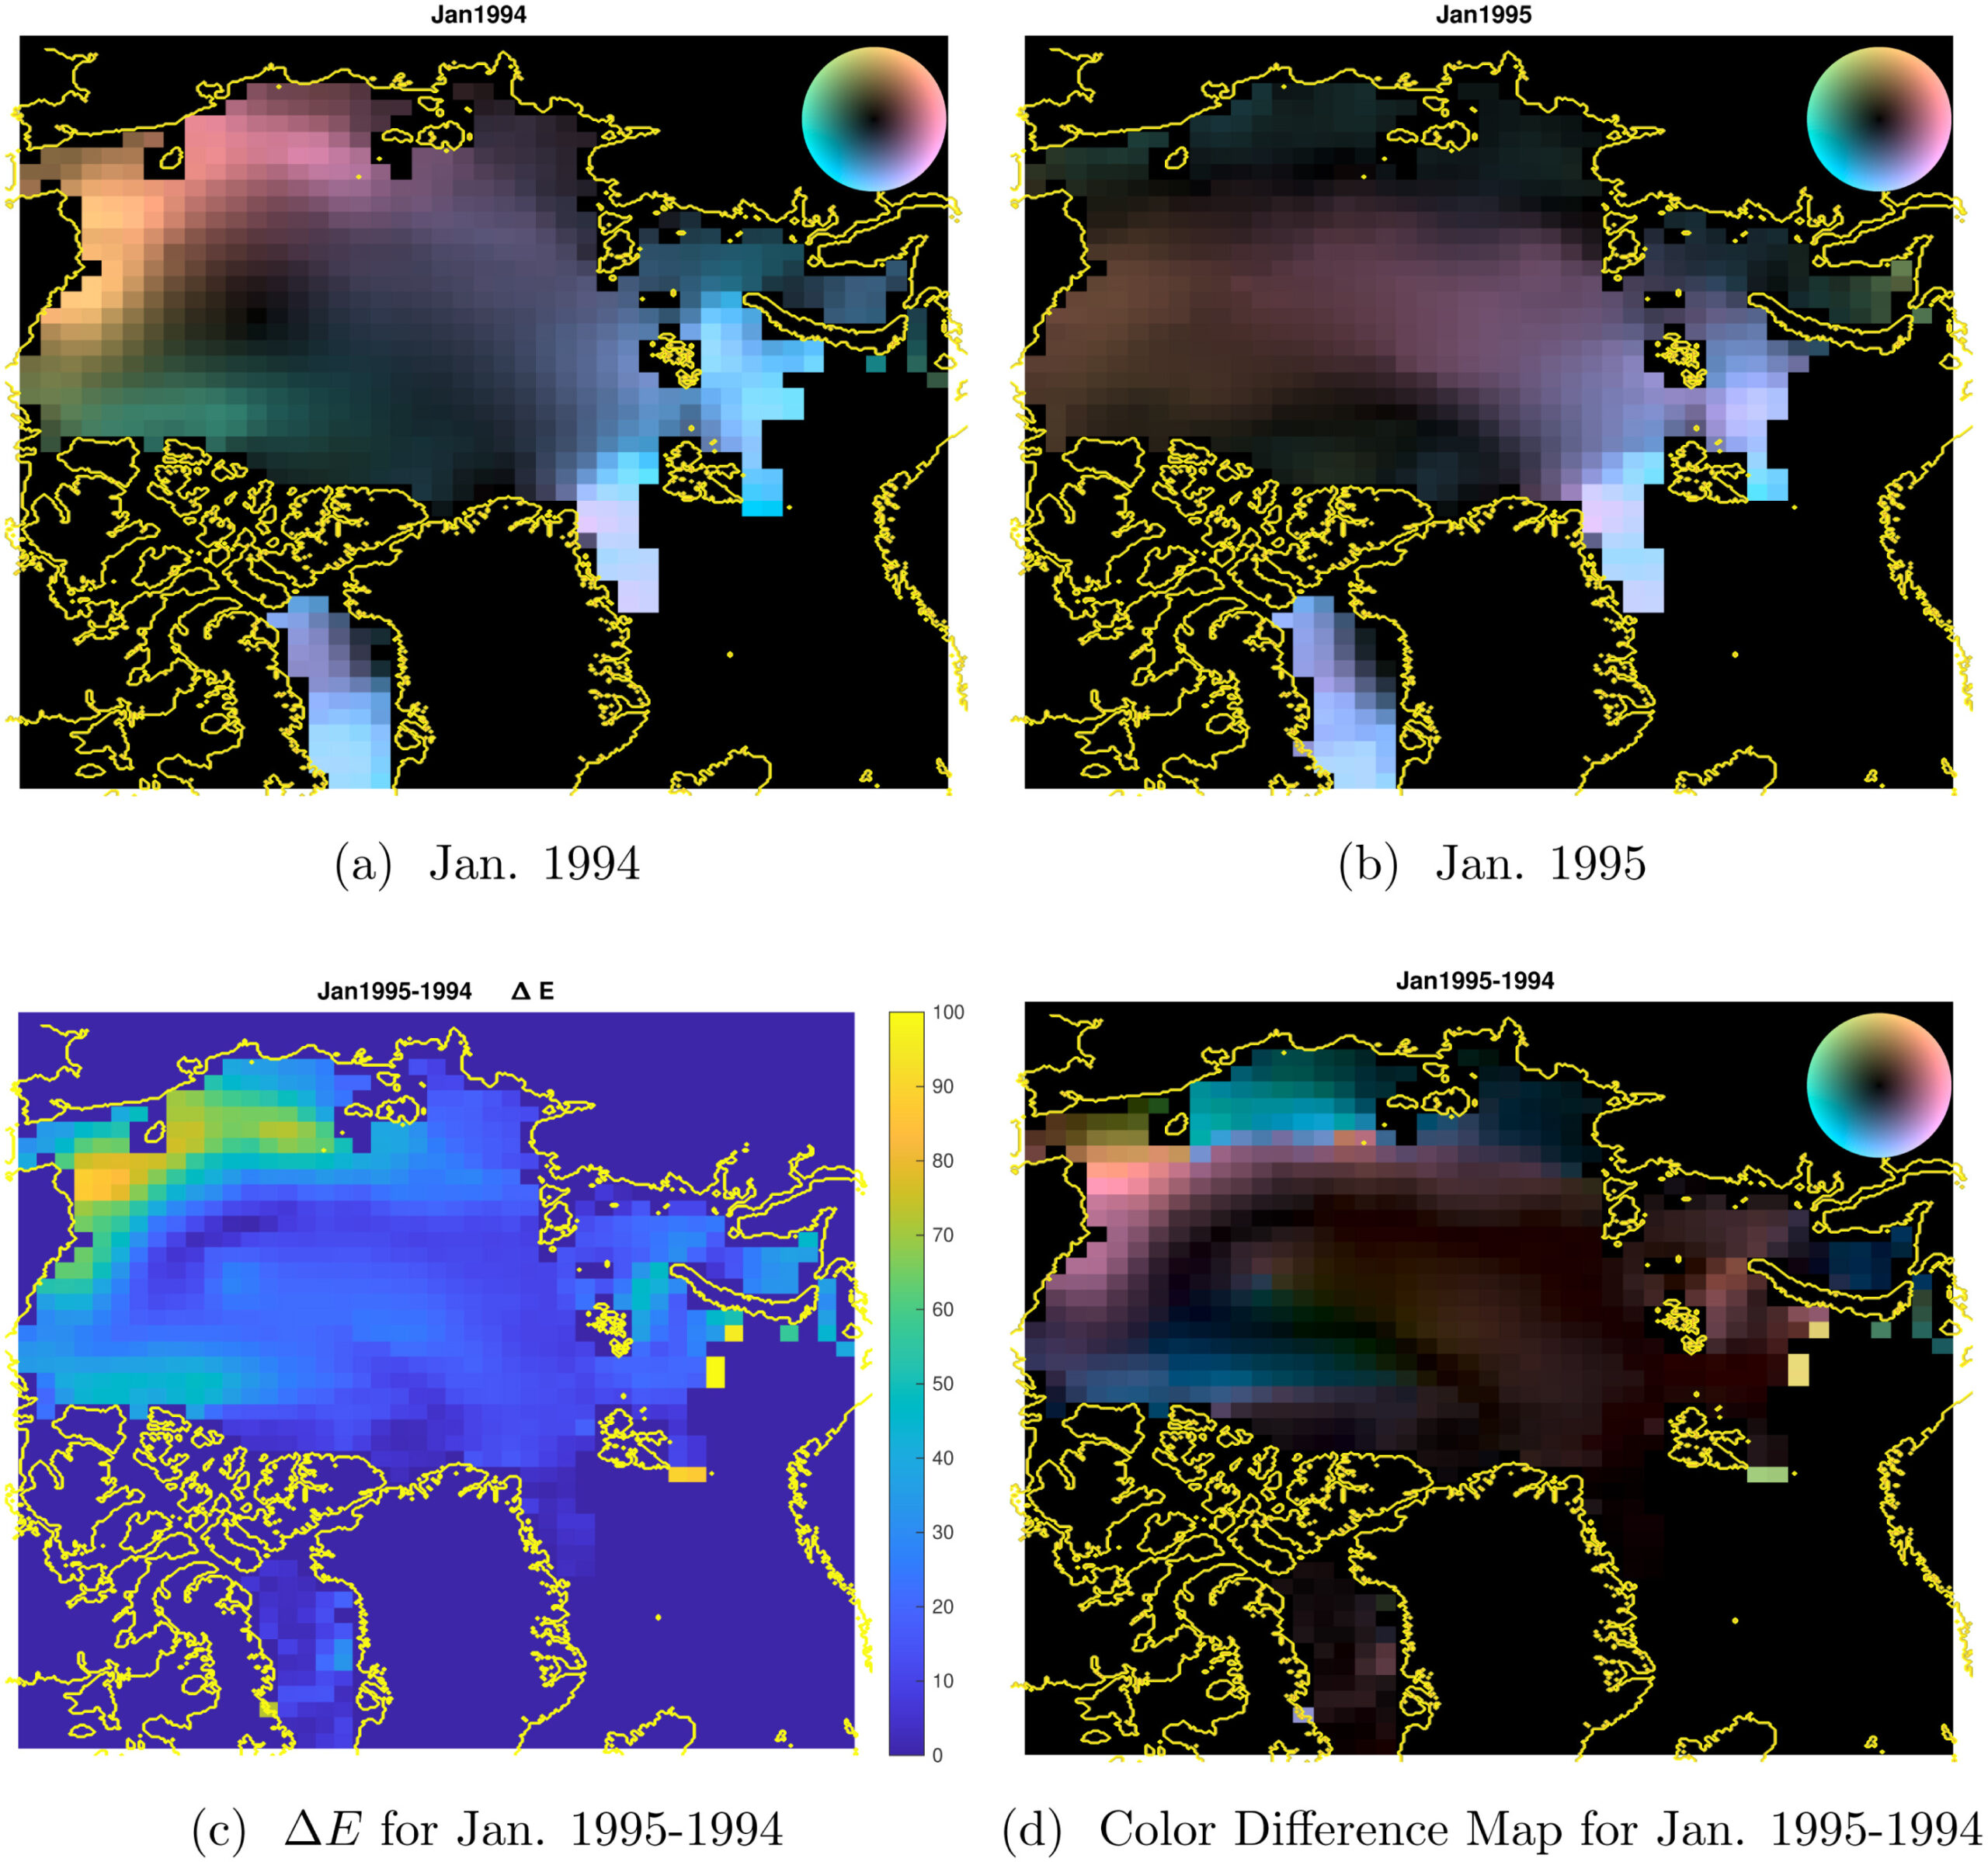
Figure 1. Visualization of Arctic ice motion in L∗Ch color space showing the strengths and sizes of the Beaufort Gyre and cyclonic flow, and how they change from season to season.
A color map for 2D vector fields provides new metrics to analyze ice motion and localized sea ice fractures.
The Science
Comparisons between images of modeled and observed ice motion and fractures provide a way to evaluate the performance of a sea ice model. However, direct comparison between patterns of fracture based on point-wise differences is flawed since fractures may be misaligned or misshapen between observations and a simulation. This motivates the need for new metrics to quantify the difference between images of fracture patterns.
The Impact
The study compares color-coded fracture patterns using new metrics based on image warping where warping aligns misaligned or misshapen features. The warping is done reliably and accurately using space filling curves to sample the images. A new image-based amplitude metric and a phase distance measure are provided to quantify differences between fracture patterns and these show promise as tools in parameter calibration.
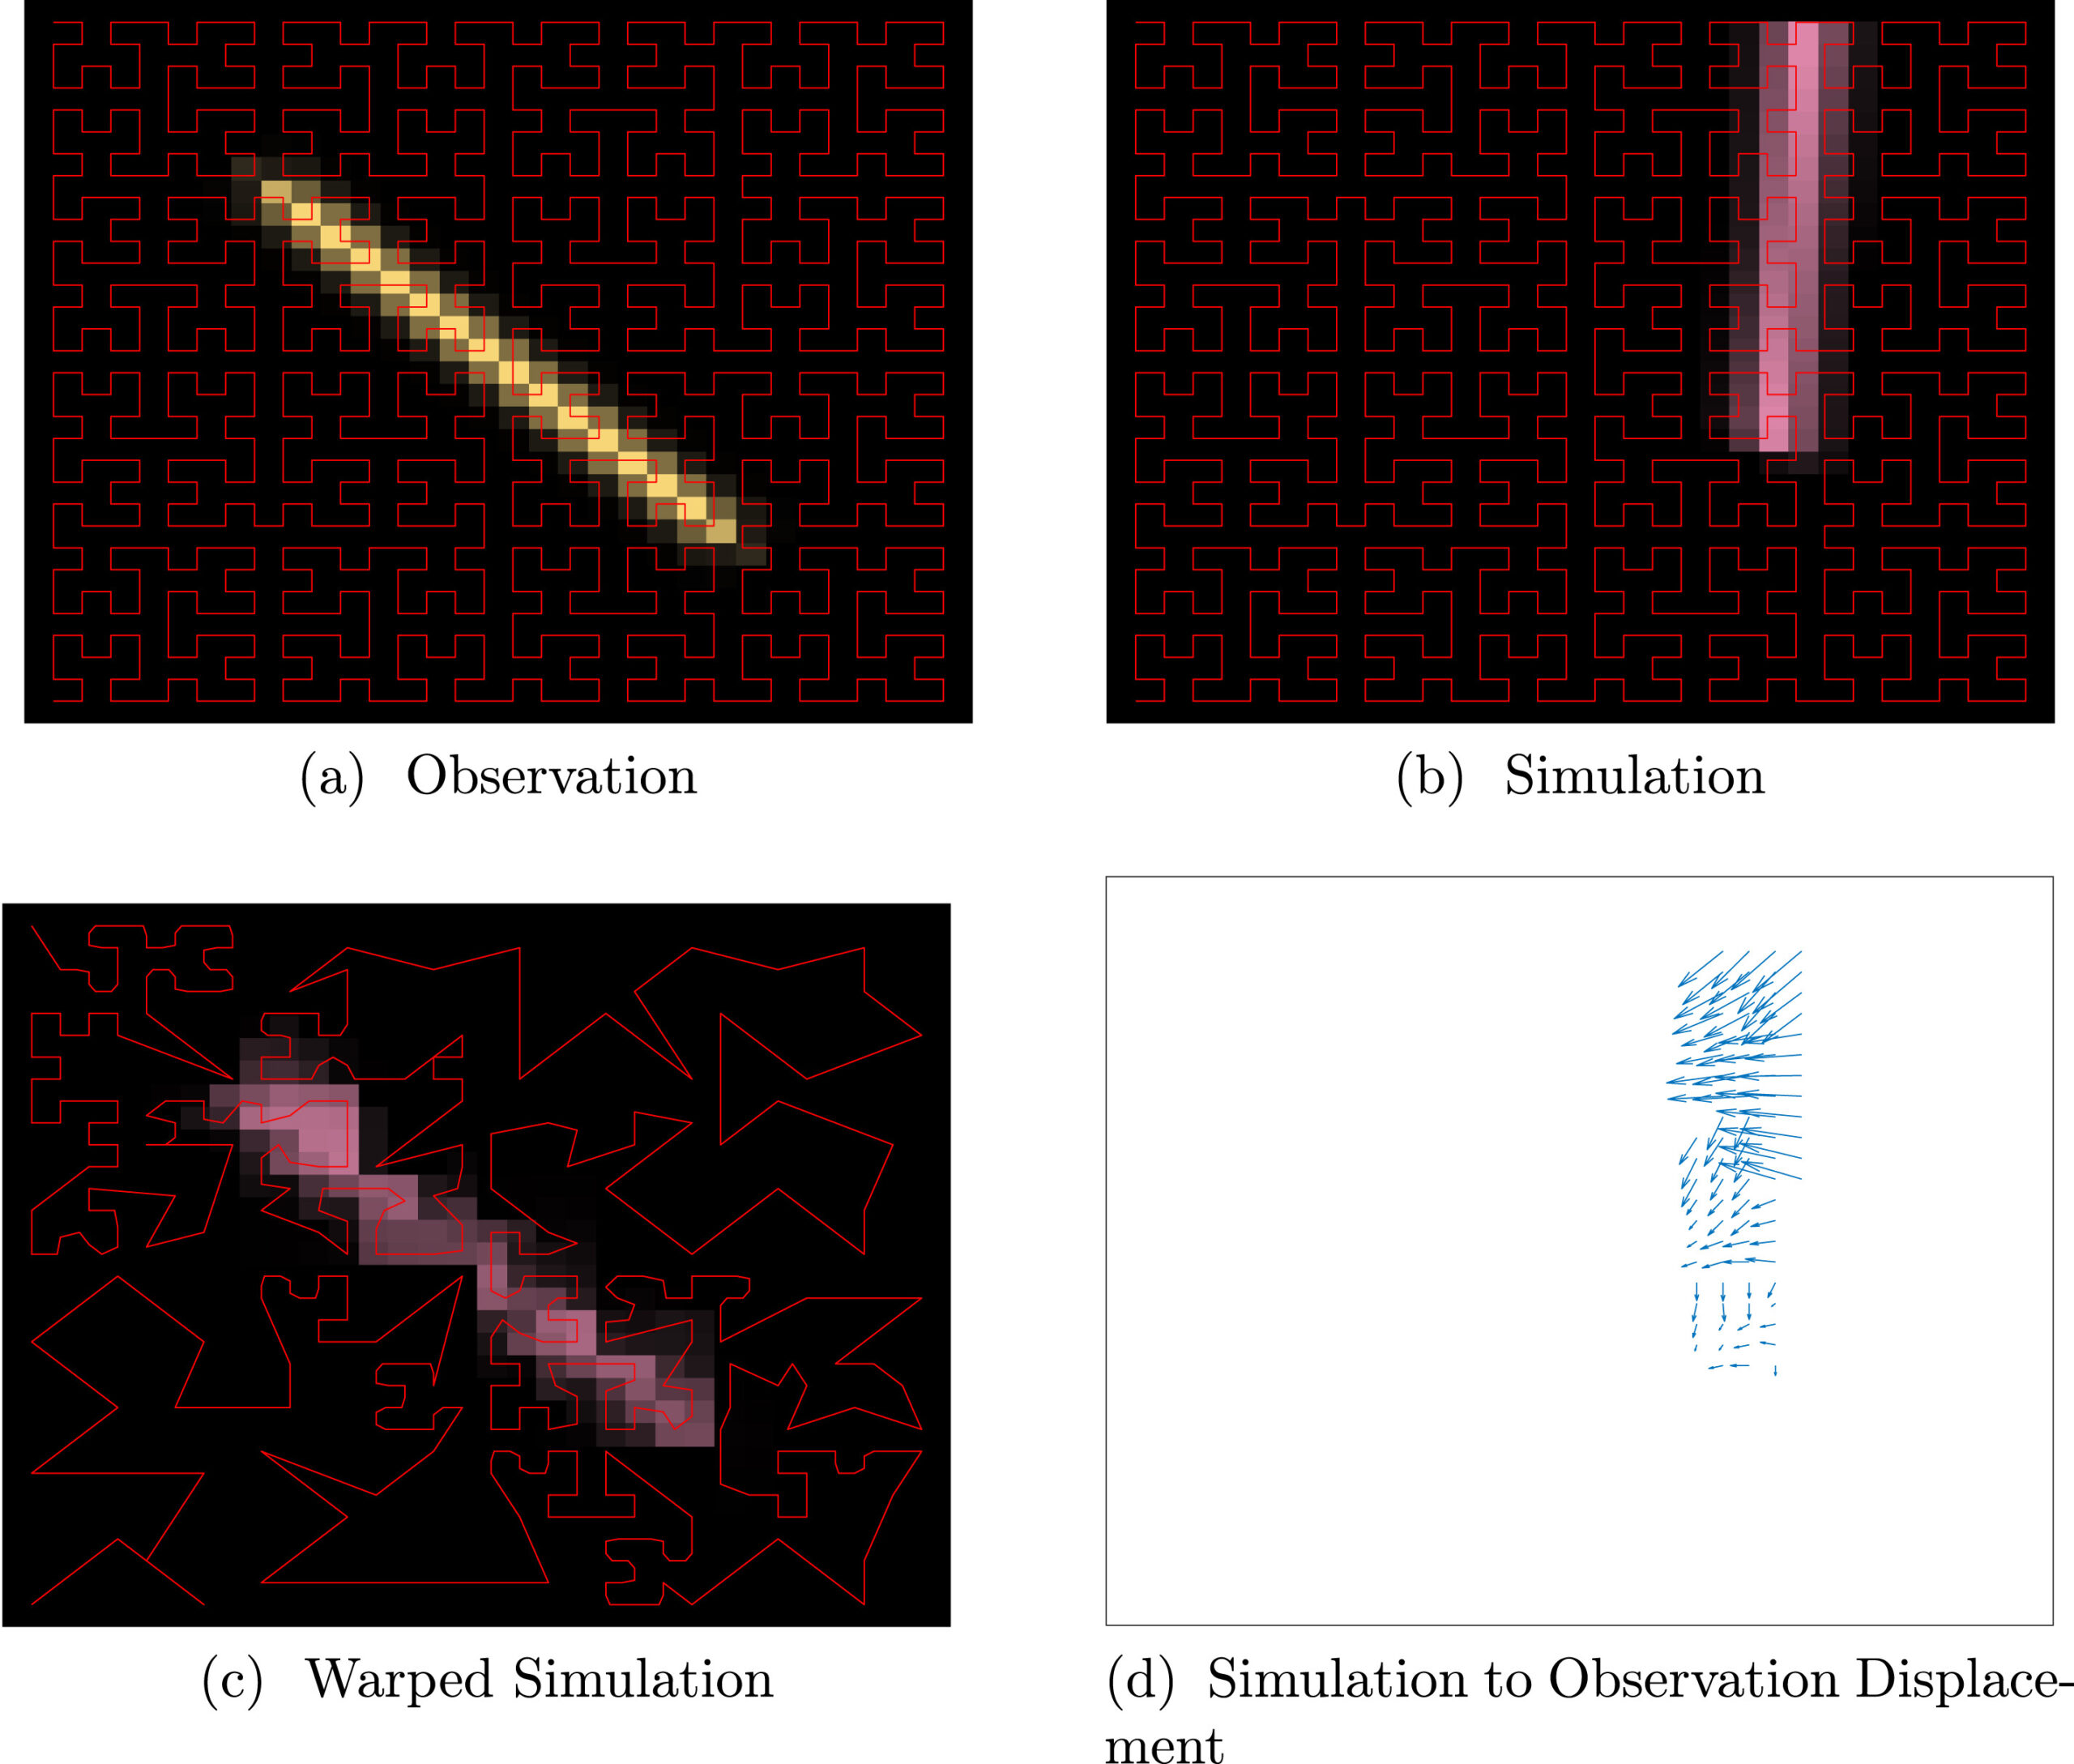
Figure 2. Color-coded idealized single crack (a,b). A space filling curve samples the images. (c) Warped space filling curve that aligns the simulation to the observation and aligns the crack. (d) Motion necessary to align images.
Summary
The study proposes a new color map for vectors based on use of the Lightness-Chroma-hue (L*Ch) color space defined by the International Commission on Illumination (CIE). This color space is designed to be perceptually uniform so that a given numerical change in the color code corresponds to a given perceived change in color. Within the color space, vector magnitude is mapped to the lightness of the color while hue (a periodic quantity) indicates the vector direction (also periodic). Additional information about the vector field can be encoded in the color map by varying the chroma. The L2 norm on the color codes induces a metric on vectors, allowing analysis and visualization of the differences in vectors through differences in color. An example, analyzing smooth vector fields from Arctic sea-ice motion in January 1994 and January 1995, is shown in Fig. 1.
The scientists also compared fracture patterns utilizing the colormap and image warping. Firstly, the fractures, described by a vector jump in displacement, are visualized using the CIEL*Ch color map. Then space filling curves are used to convert the color-mapped 2D image to a 1D function. Functional warping is then performed to rectify the misalignment between images (Fig. 2). The conversion to a function provides a simpler and more reliable numerical solution compared to 2D image warping which is computationally challenging. After optimally aligning images, two measures are defined, (1) the amount of warping needed to align the images and (2) an L2 distance after alignment. These measures quantify the differences between fracture patterns and can be visualized naturally through the color map. The potential for applying the new measures in model calibration is also explored in a multi-crack experiment.
Publication
- J. Upston, D. Sulsky, J.D. Tucker, Y. Guan. CIEL∗Ch color map for visualization and analysis of sea ice motion. Journal of Computational and Applied Mathematics, 429:115-126, 2023. DOI: 10.1016/j.cam.2023.115126
Reference
Funding
- This study was supported by the Department of Energy (DOE), Office of Science, the Scientific Discovery through Advanced Computing (SciDAC) program, under a partnership in Earth System Model Development between the Biological and Environmental Research (BER) and the Advanced Scientific Computing Research (ASCR) under Award Number DE-SC0023366.
Contact
- Deborah Sulsky, University of New Mexico
This article is a part of the E3SM “Floating Points” Newsletter, to read the full Newsletter check: