

Structural Uncertainty in Soil BGC
Effects of Structural Uncertainty on Carbon and Climate in the E3SM model
The Objective
Examine the implications of structural uncertainty in soil biogeochemistry on changes in climate and CO2 concentration in the E3SM model.
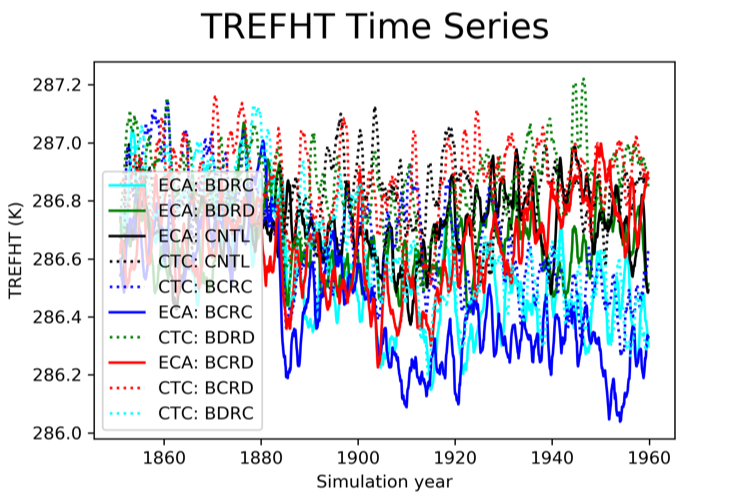
Global Mean Temperature (TREFHT) over time as modeled by two different versions of the E3SM biogeochemistry model, the ECA (solid lines) and CTC (dashed lines). All four simulations for each model deviate from the control (CNTL: black solid and dashed lines) due to the influence of land use change, non-CO2 emissions, and volcanoes.
The Impact
Results from this study provide insight into the role of soil biogeochemistry and the impacts of structural choices modelers make when representing nutrient limitation on carbon uptake.
Approach and Results
- Approach: Repeat a set of five simulations using two different versions of the E3SM v1 BGC model – the Convergent Tropic Cascade (CTC) and the Equilibrium Chemistry Approximation (ECA) – to understand the implications of structural uncertainty on carbon and climate. These simulations differ from the water cycle DECK simulations, mainly in that they actively simulate vegetation growth and nutrient limitation, while the DECK uses a prescribed seasonal cycle.
- Simulations: As of 3/31/19, ten simulations, using the two different soil biogeochemistry approaches (ECA and CTC) have completed at least 90 years each. The “C” in the simulation name (e.g. BCRD) stands for “constant” meaning CO2 concentrations are held constant throughout the model run while “D” stands for “diagnostic” meaning CO2 concentrations follow historical trajectories between 1850 and 2014. The “B” stands for biogeochemical and refers to the CO2 concentrations seen by the land, ocean and ice models as either constant (BC) or increasing over time from 1850 to 2014 (BD). The “R” stands for radiative and refers to the CO2 concentrations seen by the atmospheric model. Hence, in the BDRD simulation, since CO2 concentrations follow historical trajectories for the land, ocean and ice as well as the atmosphere, it is a fully concentration-driven simulation showing both radiative and biogeochemical climate responses to CO2. (See the tables on the Status of v1 BGC Campaign page for more details.)
- Results: The simulations with constant radiative effects of CO2 (last two letters = RC in graph below) start to deviate starting in 1900, showing cooler temperatures. Simulations using ECA (solid lines) appear to be cooler than CTC (dashed lines), especially for the BCRC simulations; however, there is still significant internal variability. The two versions of the model also have differences in carbon pools; CTC has higher vegetation carbon, while ECA has higher coarse woody debris. When CO2 is allowed to affect biogeochemistry both configurations (ECA and CTC) simulate increased photosynthesis and vegetation growth.
Contact: Kate Calvin, Pacific Northwest National Laboratory (PNNL)
Funding: The Department of Energy, Office of Science, Office of Biological and Environmental Research and Advanced Scientific Computing Research (BER/ASCR).