

Waves in E3SM: a Core Coupled Capability for Polar Coastal Science, Energy Applications, and S2S2D Prediction
The imminent E3SMv3.2 release has added ocean surface waves as an active component of the coupled air–ocean–sea ice modeling system. The first part of this work was completed last year, and implemented ocean wave-state-dependent surface fluxes in the atmosphere and demonstrated their influence on coupled tropical variability, including impacts on the representation of the Madden–Julian Oscillation. The second part of the work involves wave-sea ice coupling. It evolved from a collaboration between E3SM, the Interdisciplinary Research for Arctic Coastal Environments (InteRFACE) project, and the CICE Consortium. This work has coupled WAVEWATCH III (WW3) to MPAS-Sea Ice so that waves are attenuated as they travel across polar oceans and break sea ice into floes as they go, generating the egg-shell pattern of fractured ice so often associated with Earth’s high latitudes.
These developments provide a new capability for E3SM to explore global sub-seasonal to seasonal to decadal (S2S2D) predictability. In the Arctic and Antarctic, waves interact with sea ice and the marginal ice zone through processes that affect ice-edge evolution, floe-size distribution, upper-ocean mixing, coastal flooding, sediment transport, air–sea exchange, and marine access. The combined coupled WW3–MPAS-Ocean–MPAS-Sea Ice framework facilitates studying and predicting global atmosphere–ocean–ice interactions with a more realistic surface marine state. This capability further improves possible energy applications of E3SM, including analyzing global shipping paths for factors ranging from long period waves generated by tropical cyclones to convergent episodes in pack ice, which impact both the energy use and open passage for shipping of commodities, including oil and liquid natural gas (LNG).
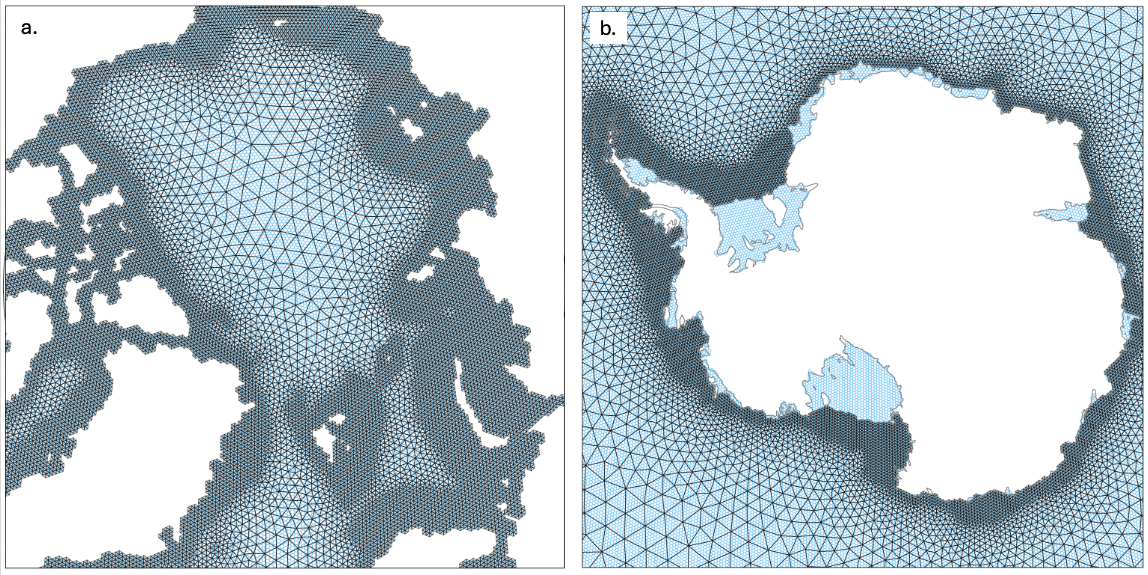
Figure 1: Combined, coupled unstructured meshes of E3SM’s ocean model (blue) and waves model (black) for the (a) the Arctic and (b) the Southern Ocean.
To better understand the global impact of sea ice-wave interaction, an experiment is underway as part of the E3SM Polar Dynamics Group’s BluePulse experiment using the new E3SM low resolution waves (LRW) configuration (standard resolution with fully active waves) set on unstructured meshes (Figure 1). The E3SMv3 global unstructured wave mesh is unique amongst other global earth system models and has been carefully designed to use higher resolution that exactly matches the MPAS-Ocean mesh in shallow, coastal regions and coarse resolution in deep water. This allows for accurate wave spectra in shallow regions where high resolution is physically needed, yet reduces computational costs by limiting the number of nodes in deep water where the resolution is redundant.
The BluePulse experiment is using Artificial Intelligence (AI)-enabled signal processing with wavelet encoding of E3SM output to extract transient subseasonal-to-seasonal-to-decadal (S2S2D) signals in polar oceans from sea ice, ice shelves, and ocean waves to explore their global teleconnections in the Earth system. The LRW BluePulse experiment is specifically targeting Earth system impacts of wave – sea ice and wave – atmosphere polar and global coupling with this experimental design:
- 25-member LRW V3.2 40-year 21st century S2S2D ensemble, starting with a 2010 control.
- Analysis of the global coupled S2S2D system signal in the presence of ocean waves and wave-affected sea ice filtered to target seasonal, annual and decadal lead-lag signals.
Preliminary results from LRW experiments indicate changes across sea ice zones, but especially in marginal ice zones where surface state transitions from open ocean to pack ice. Figure 2 illustrates daily-mean significant ocean wave height (left panels) and the daily mean sea ice floe diameter (right panels) just one day apart. The grey contour encircles sea ice concentration 15% or greater. Red arrows highlight an area with significant sea ice breakage East of Greenland due to high wave activity. Such sea ice break-ups are characterized by a rapid reduction in the mean floe diameter that corresponds to large wave heights penetrating the frozen ocean. In this case, rapid break-up occurs in January when the sea ice is generally strengthening, illustrating the significant role of waves affecting seasonal navigability.
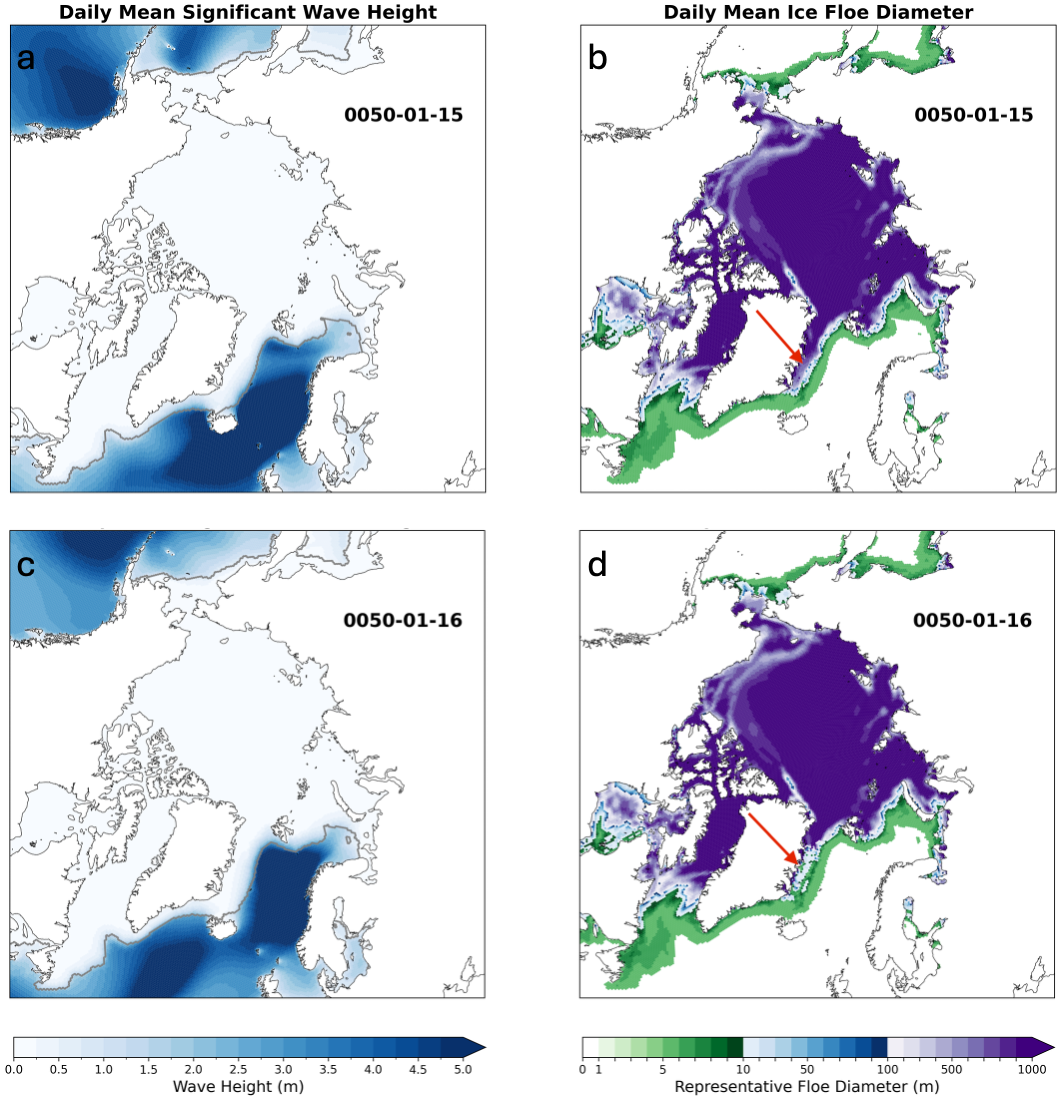
Figure 2: E3SM BluePulse LRW control simulations 50 years after initialization, indicating the impact of a high waves event in the North Atlantic on sea ice floe sizes off the East coast of Greenland. (a) and (c) show significant wave height with the gray sea ice extent contour (15% concentration), while (b) and (d) illustrate the mean floe size diameter, extracted from a floe size distribution simulated within the E3SM’s sea ice model.
E3SM’s S2S2D large ensemble with waves represents a unique opportunity to analyze global ocean waves probabilistically with the advantage of realistic physics from the tropics to the poles on timescales of days to years. The team eagerly looks forward to the discoveries this capability unlocks.
Contact
- Erin Thomas, Los Alamos National Laboratory
- Andrew Roberts, Los Alamos National Laboratory
This article is a part of the E3SM “Floating Points” Newsletter, to read the full Newsletter check:
- E3SM Floating Points, May ’26: Looking Forward to the Summer All-Hands
