

Using Machine Learning to Map Transformation Rates of Dissolved Organic Carbon in Rivers
Researchers mapped the transformation of a key riverine component across the United States to ultimately improve Earth system models
The Science
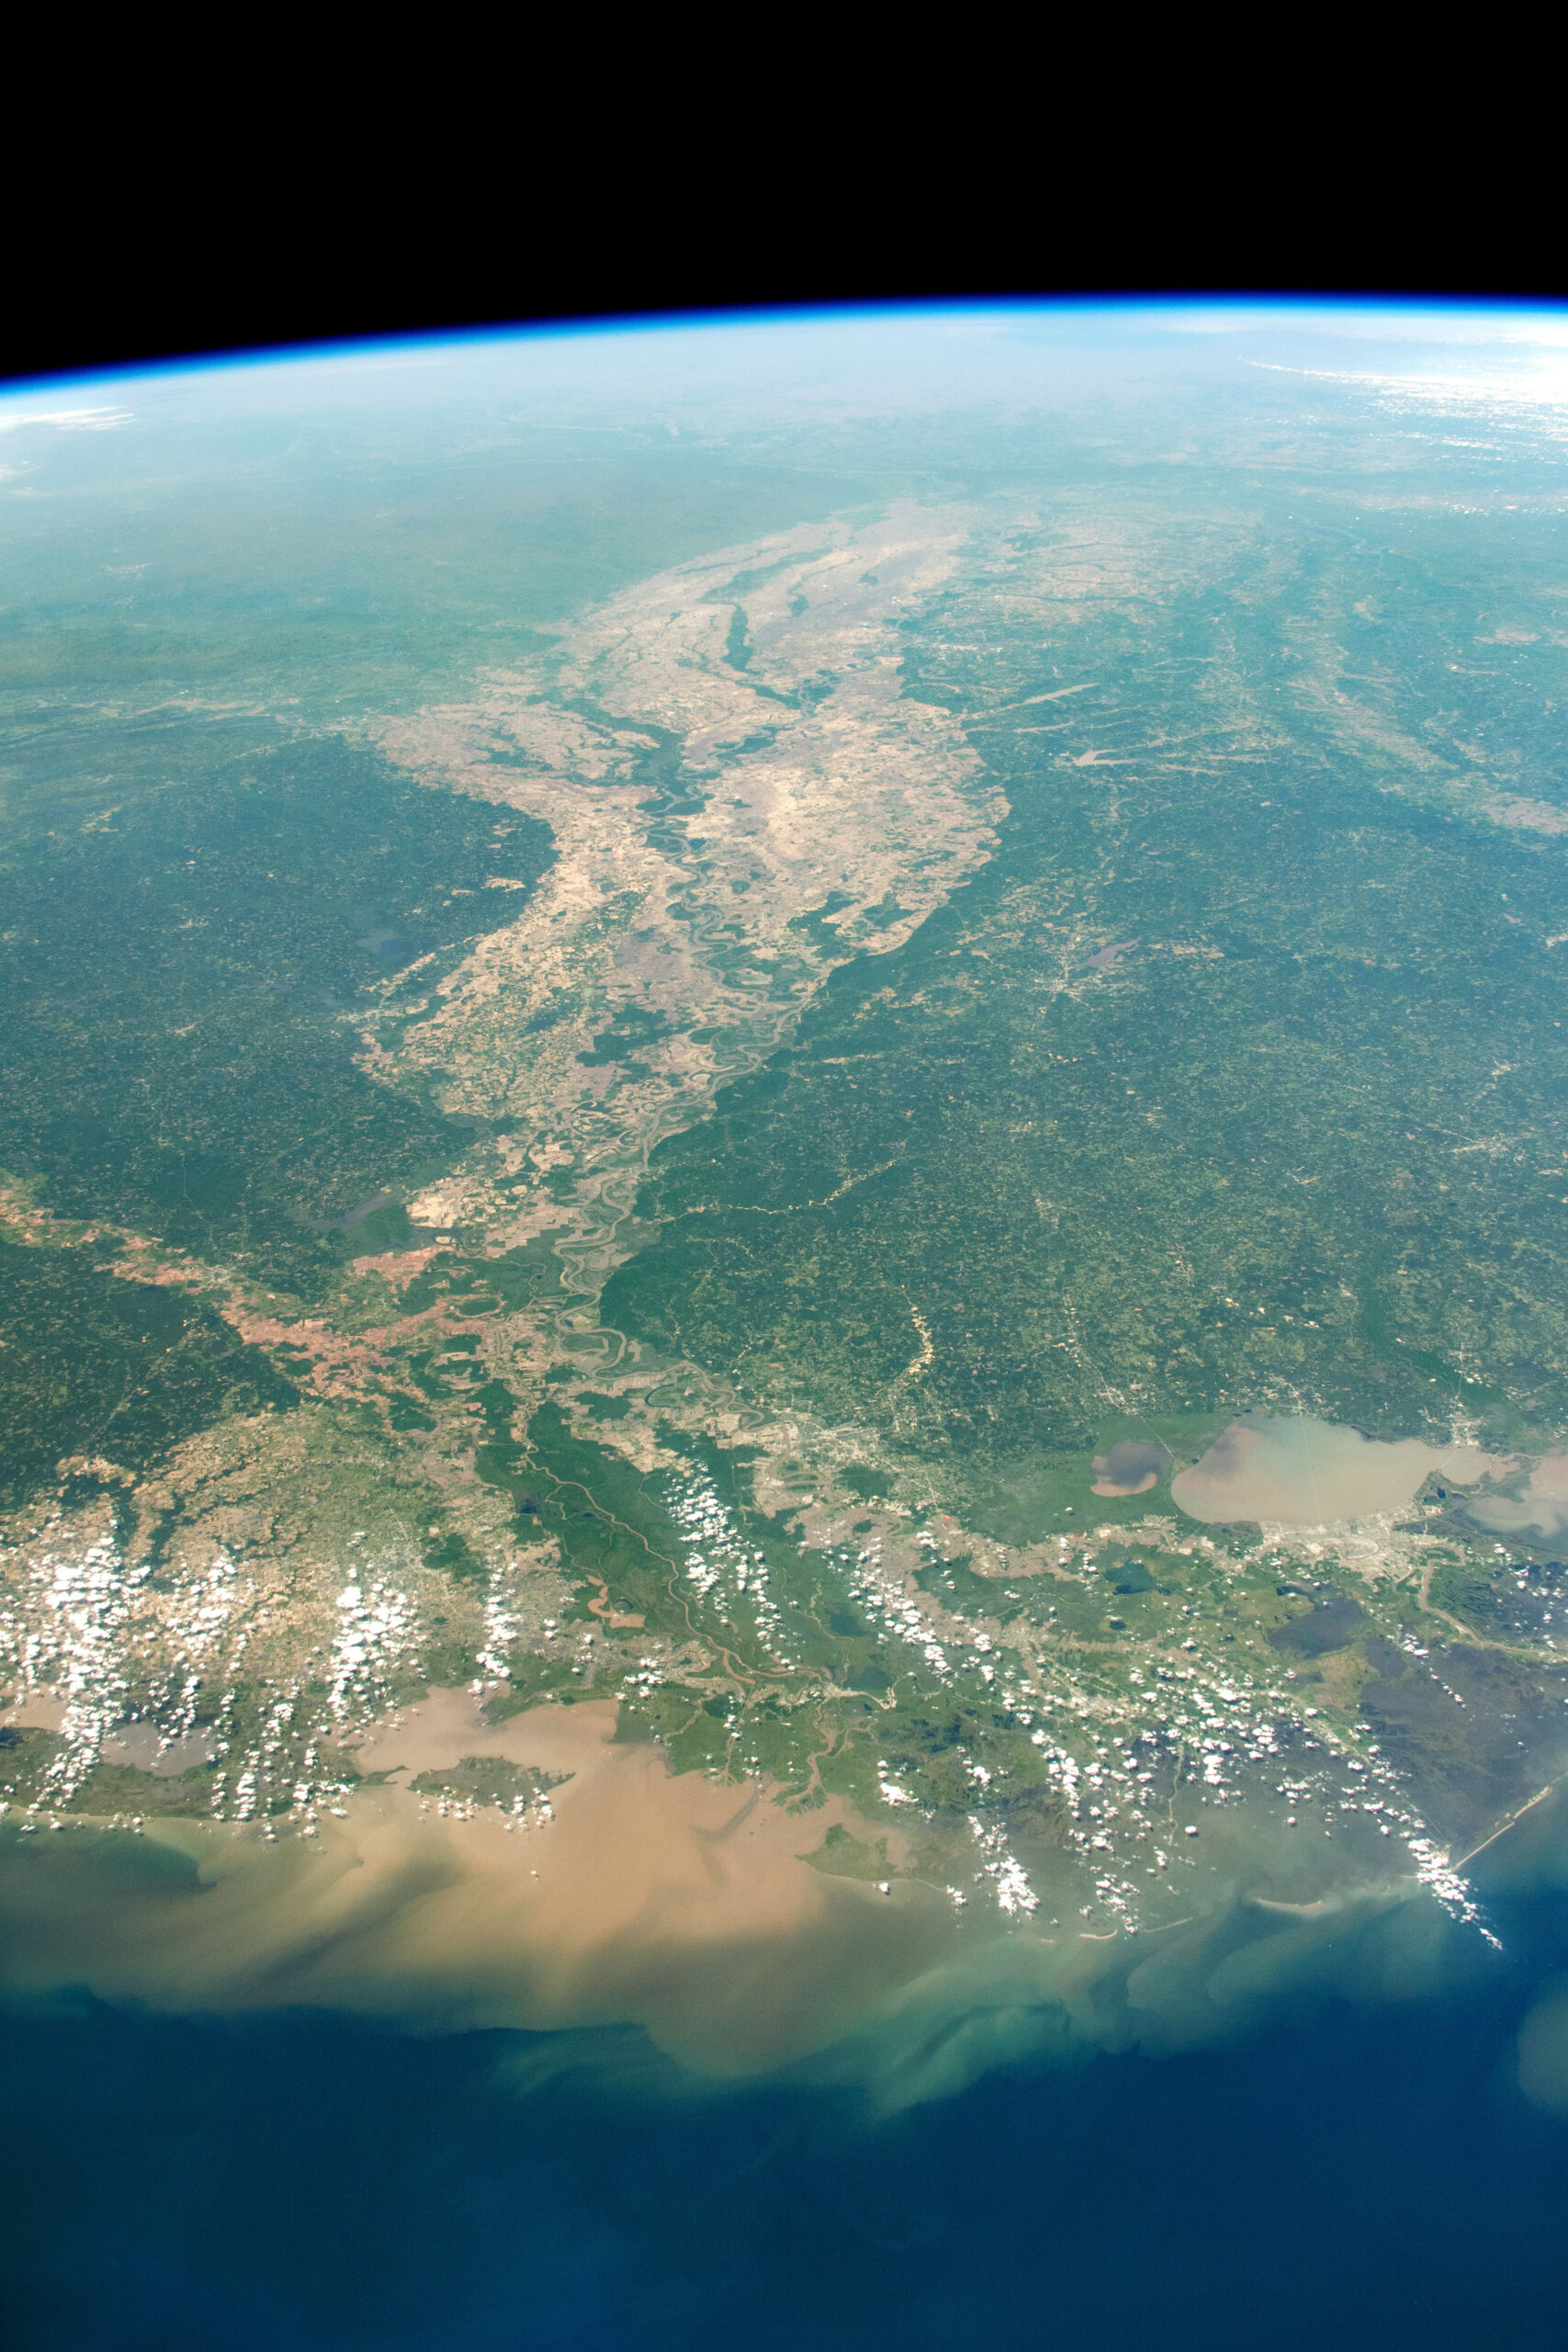
Image by the ISS Crew Earth Observations Facility and the Earth Science and Remote Sensing Unit | Johnson Space Center.
Riverine dissolved organic carbon (DOC) plays a vital role in regional and global biogeochemistry cycles. Annually, rivers transport nearly 2 billion metric tons of DOC from land to oceans, affecting aquatic ecosystems and greenhouse gas emissions. Simulating riverine DOC in Earth system models has been hampered by the poorly understood soil-to-river DOC transfer processes whereby soil organic carbon (SOC) is converted into DOC. However, understanding this flux is important for building comprehensive Earth system models to predict global processes that can affect energy systems.
The Impact
Researchers addressed this critical gap by developing a new map that reveals how SOC transforms into DOC and leaches into headwater streams over the contiguous United States (Fig. 1). The new machine learning (ML) model captured intricate relationships between environmental factors and transformation rates, which is where traditional models tend to struggle. The use of ML offers a new and effective way to predict carbon leaching fluxes, previously missing from Earth system models. This is the first time a spatially continuous map showing SOC to river DOC transformation rates was derived at the continental scale, providing a powerful tool for scientists. The research enhances the understanding of how carbon moves from soils into rivers, which is vital for modeling nutrient cycle changes, and is thus a significant step toward better understanding and predicting changes in carbon cycles, which ultimately will help bolster Earth system models. The approach can potentially be adapted to other regions and contribute to Earth system modeling at the global scale, helping researchers explore and predict environmental changes more accurately. This ultimately will help support resilient energy systems.
Summary
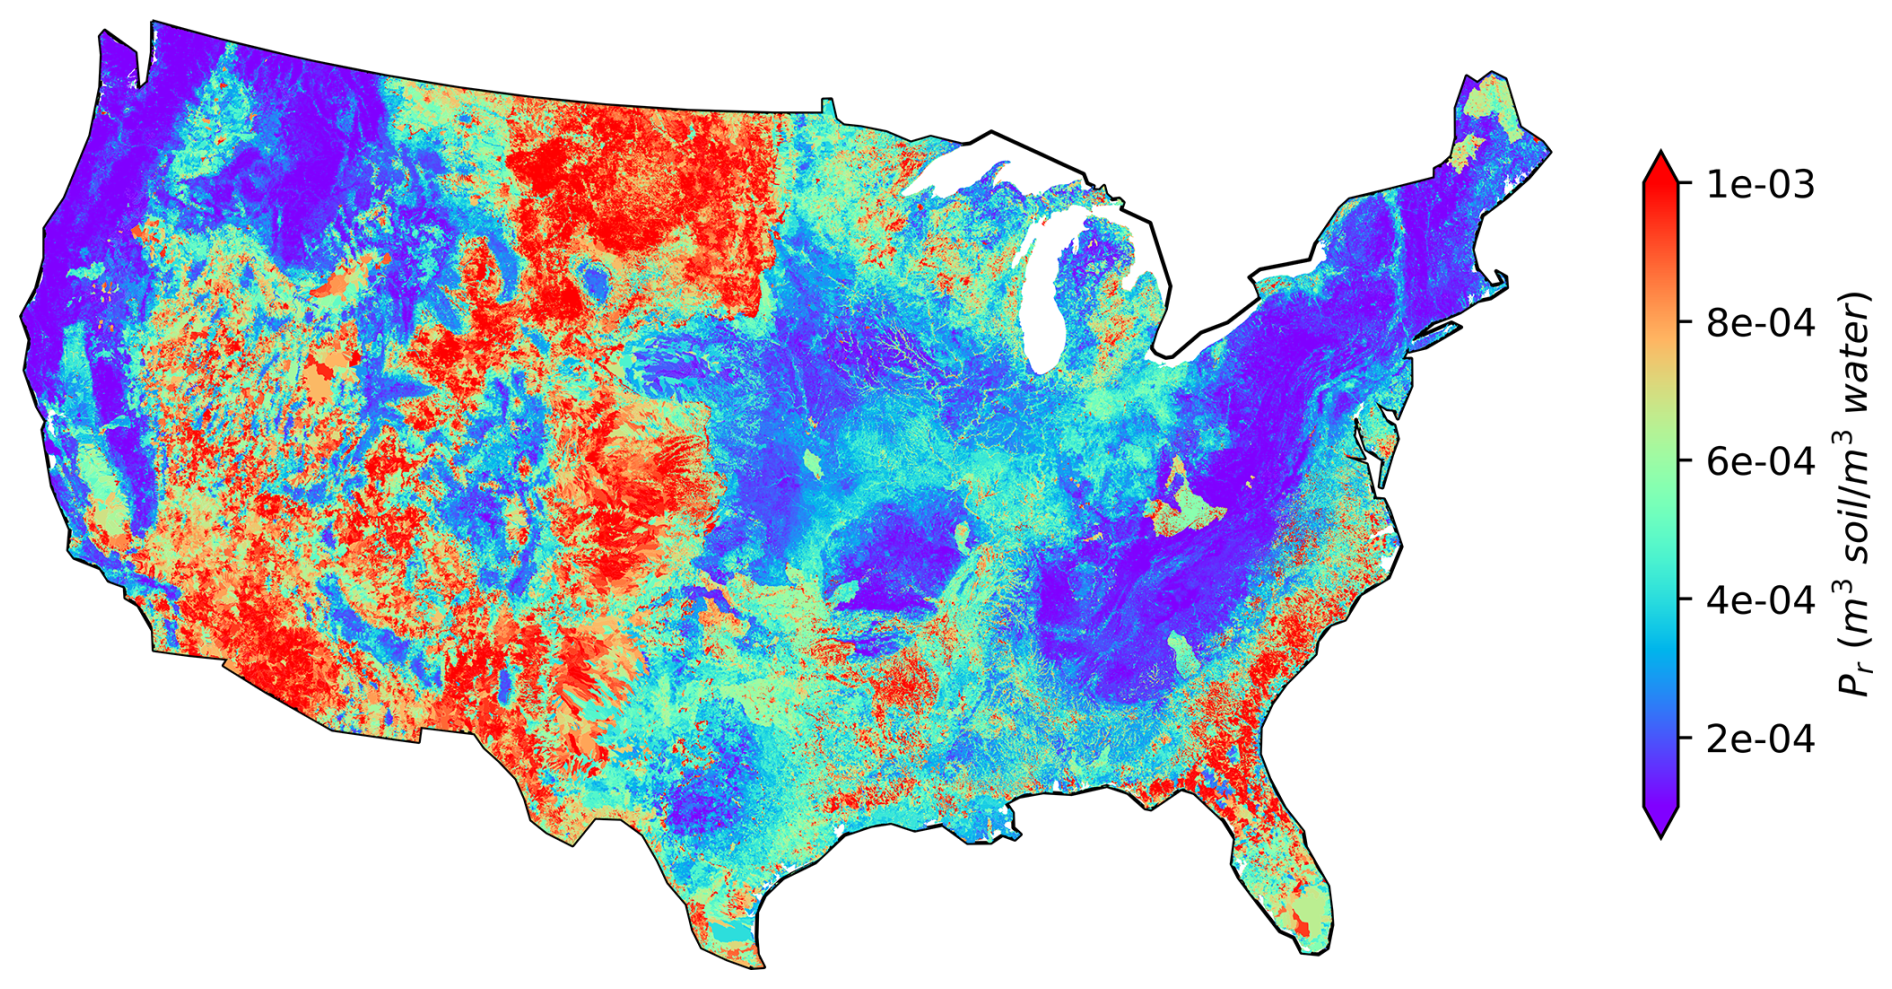
Figure 1. A national map of DOC transformation rates over 2.6 million small catchments. Consistent with the transformation rates derived from observations, higher transformation rates (warmer colors) are mostly found in the southeast coast, desert southwest, and North Dakota.
Researchers proposed a new formula that directly connects SOC concentration with DOC concentration in headwater streams, using a single transformation rate to account for all relevant processes. They then developed a machine learning (ML) based approach to predict SOC transformation rates to DOC across 2.6 million watersheds across the continental United States. They used advanced artificial intelligence techniques to analyze a breadth of data types, including observations at 2,595 water level gauges and other key environmental attributes, spanning hydrology, geology, and atmospheric science. From here, the team was able to generate the high-resolution map across the United States (Fig. 1), providing a spatially continuous representation of transformation rates.
Publication
- Li, L., Li, H.-Y., Abeshu, G., Tang, J., Leung, L. R., Liao, C., Tan, Z., Tian, H., Thornton, P., and Yang, X.: Transformation rate maps of dissolved organic carbon in the contiguous US, Earth Syst. Sci. Data, 17, 2713–2733, https://doi.org/10.5194/essd-17-2713-2025 , 2025.
Funding
- This research was supported by the Office of Science of the U.S. Department of Energy Biological and Environmental Research as part of the Earth System Model Development program area through the Energy Exascale Earth System Model (E3SM) project.
Contact
- L. Ruby Leung, Pacific Northwest National Laboratory