Detection and Attribution Analysis of Drivers Affecting Columbia River Basin Streamflow
Streamflow in the Columbia River Basin: Quantifying Changes Over the Period 1951‐2008 and Determining the Drivers of Those Changes

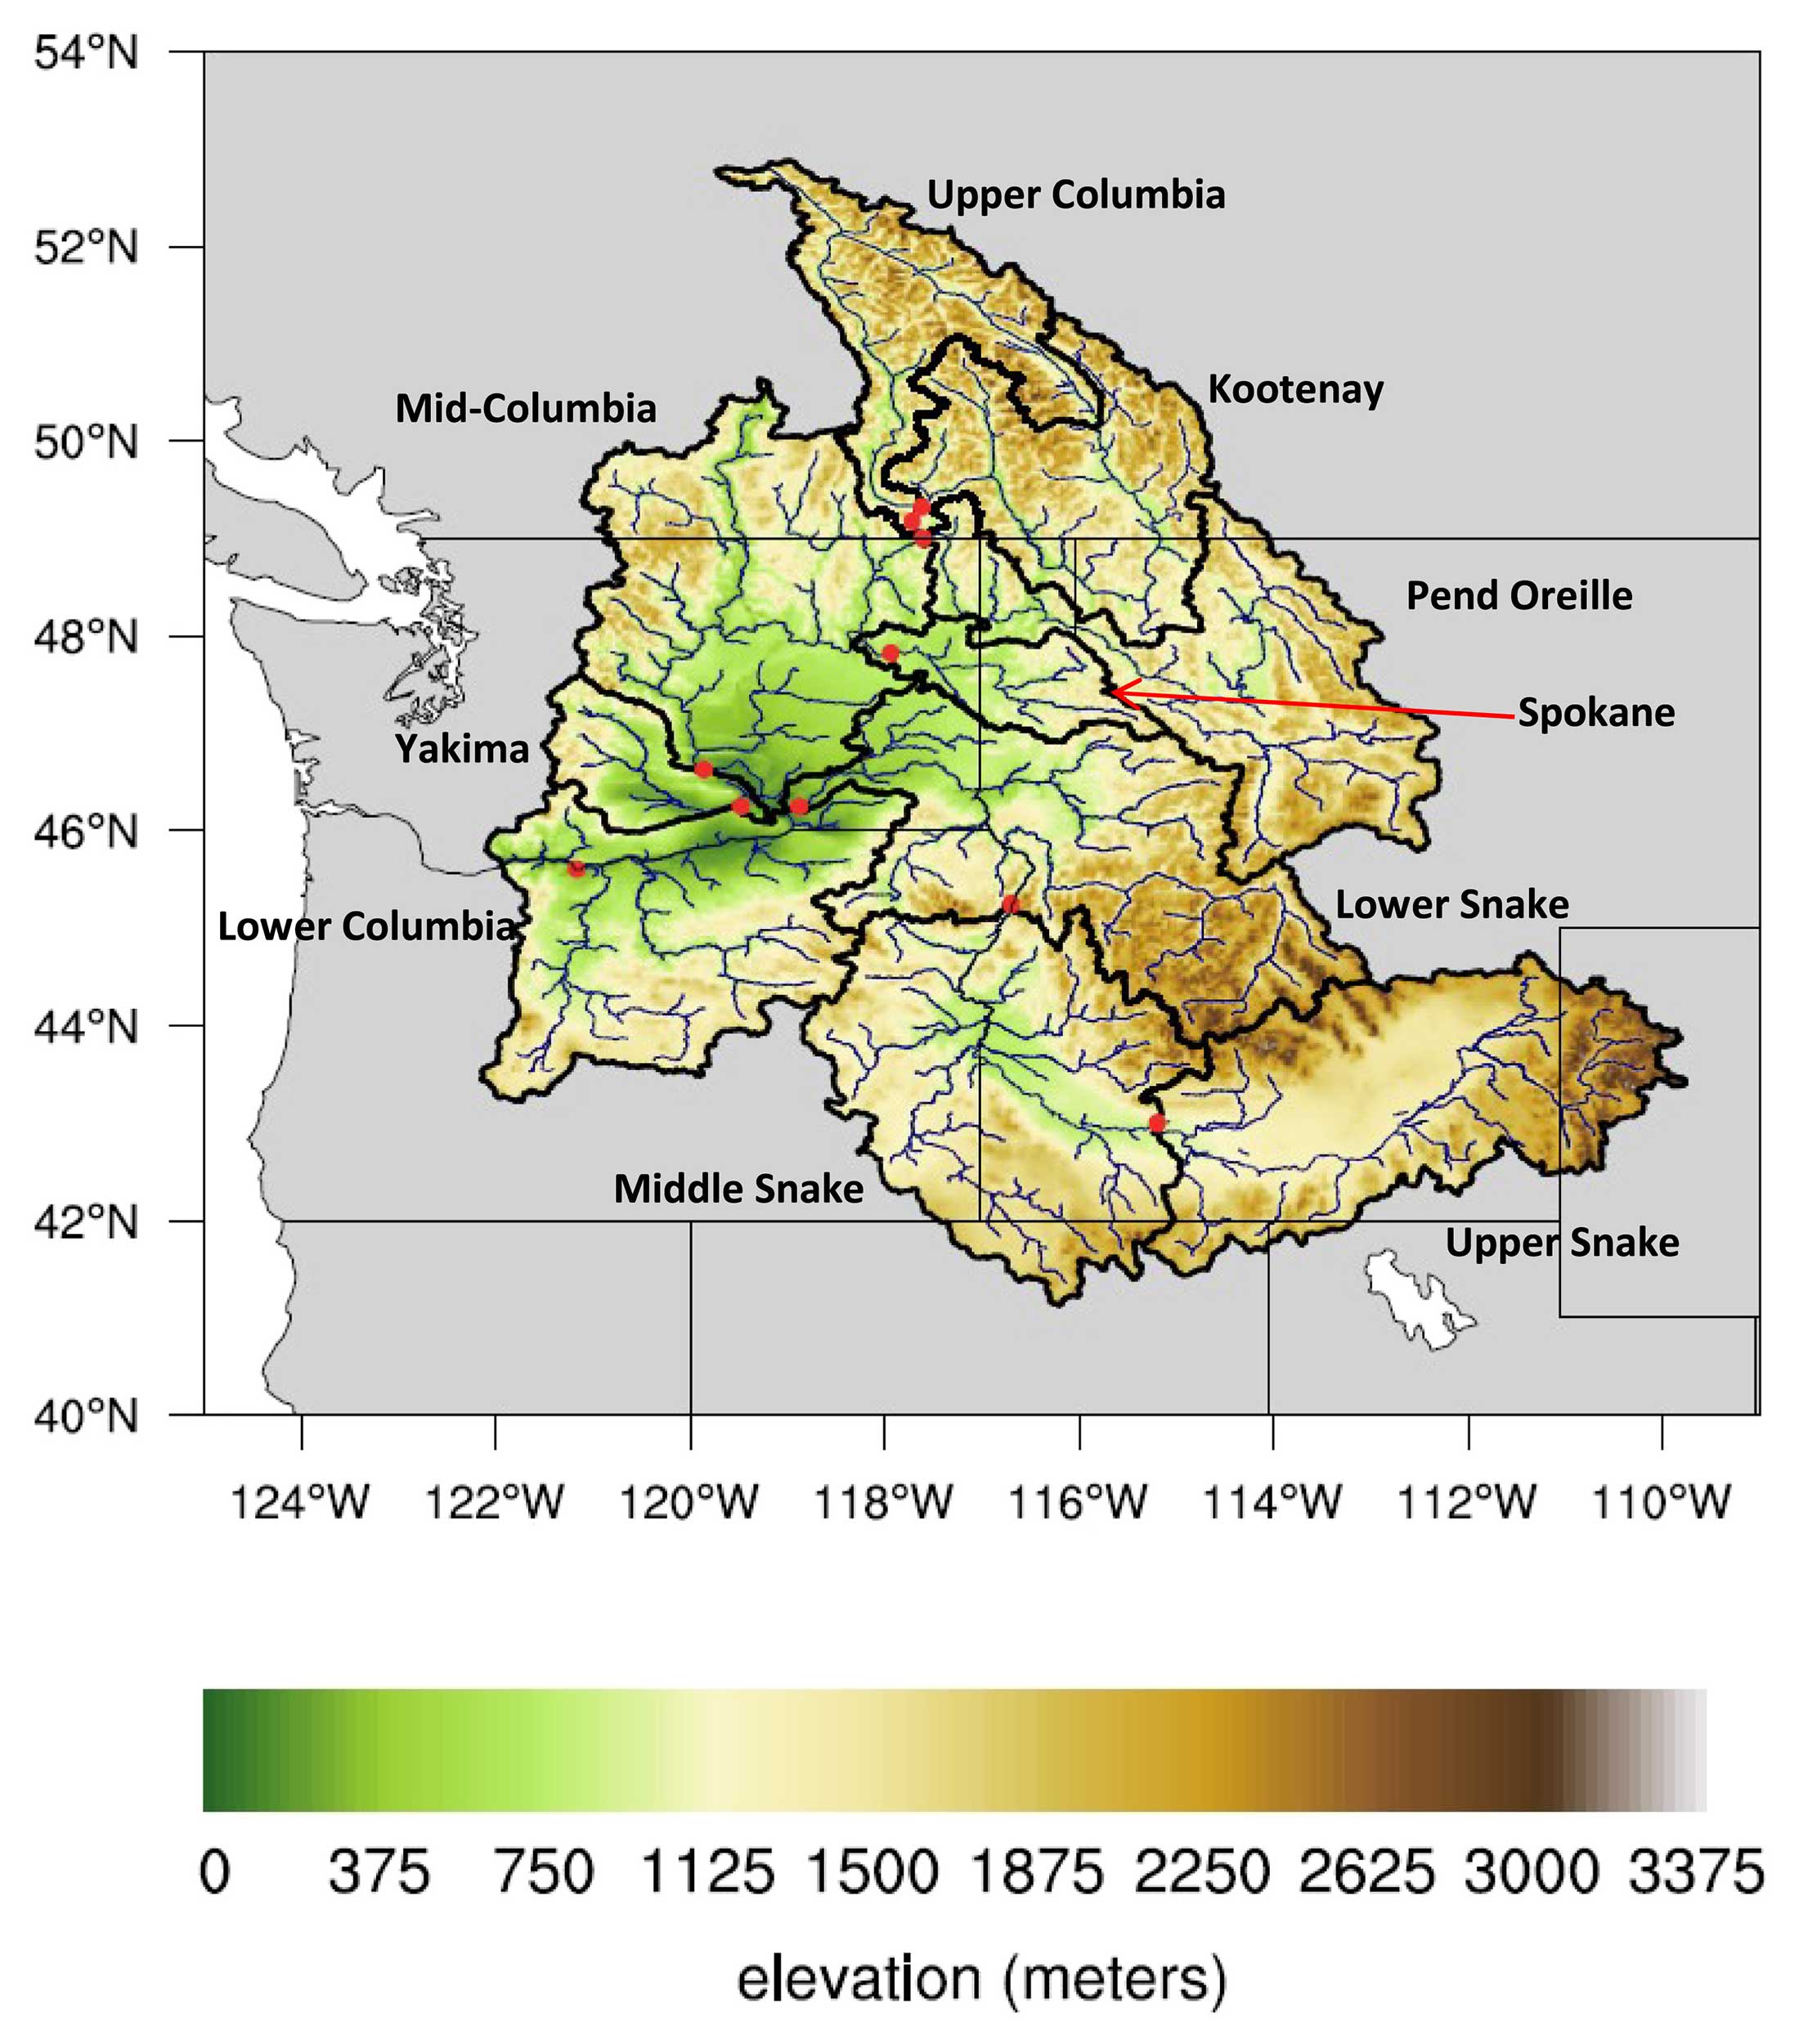
Columbia River Basin topographic map showing the major river segments, subbasins, and farthest downstream stations.
Background
The Columbia River Basin (CRB) is an important river basin in the Pacific Northwest due to its many significant ecological and environmental benefits, as well as its use to the community for irrigation, navigation, fishing, recreation, and hydropower generation. Previous studies have predicted that projected future western U.S. snowpack will decline up to 60% in the next 30 years (Fyfe et al., 2017) and that by 2050, the Columbia River system would not be able to sustain historical levels of both spring and autumn water releases for hydropower generation and releases for spring and summer salmon runs (Barnett et al., 2005). In this study, trend, detection, and attribution analyses were performed using newly available streamflow observations and model simulations to understand the factors that were most important to observed changes in the Columbia River streamflow.
The objective of detection and attribution analysis is to assess the evidence contained in observations. From the IPCC’s “Good Practice Guidance Paper on Detection and Attribution Related to Anthropogenic Climate Change” paper:
- “Detection of change is defined as the process of demonstrating that climate or a system affected by climate has changed in some defined statistical sense without providing a reason for that change.” and
- “Attribution is defined as the process of evaluating the relative contributions of multiple causal factors to a change or event with an assignment of statistical confidence.”
The causal factors mentioned above, also known as external drivers or forcings, can be anthropogenic (e.g. greenhouse gases, aerosols, or ozone precursors) or natural (e.g. volcanic eruptions or solar cycle modulations). For this study, researchers focused on climate change, CO2 concentration, nitrogen deposition, and land use and land cover change as the external drivers.
Impact
Scientists ran Energy Exascale Earth System land-surface model (ELM) simulations in combination with the Routing Application for Parallel computatIon of Discharge (RAPID) routing model to calculate streamflow under different combinations of pre-industrial and historically varying forcing conditions. The correlation-based detection and attribution (D&A) and linear regression-based D&A analyses were then used to detect changing trends and to quantify the driving environmental mechanisms for the Columbia River Basin streamflow during the 1951-2008 period. Researchers used the RAPID river routing model to accumulate the ELM simulated runoff through a much higher resolution non-gridded river network. The widely used NHDPlus river network was used on the United States side of the CRB, and the river network developed by the U.S. Army Engineer Research and Development Center (Wahl et al., 2016) was used on the Canadian side. Together, they formed ~192,000 high resolution CRB river segments. In addition to combining the ELM with the more detailed RAPID river model, scientists assembled long-term naturalized streamflow data and developed streamflow metrics that can be incorporated into the International Land Model Benchmarking (ILAMB) package for future model evaluations.
Summary
Four main potential drivers – climate change, CO2 concentration, nitrogen deposition, and land use and land cover change – were analyzed using a D&A framework to determine which drivers may be responsible for trends in key streamflow variables. For this analysis, the ELM version 1.0 and RAPID routing model were used to conduct semi-factorial simulations driven by multiple sets of bias-corrected forcing datasets. All subbasins showed significant declines in the observed amount of annual total streamflow, except for the Middle and Upper Snake and Upper Columbia Subbasins. These declines were led by significant decreases in June–October streamflow, which were directly associated with significant decreases in peak and summer streamflow. Except for the Snake River Subbasins, simulations indicated that land use and land cover change induced the same pattern of declines in monthly streamflow, but the period was shifted to May–September. Nitrogen deposition also was responsible for significant trends in June–October in simulations; however, rather than decreases, the trends showed significant increases in streamflow. While there were significant trends in CO2 concentration, nitrogen deposition, and land use and land cover change, their signals of change were weak in comparison to the climate change signal and the natural internal variability found in streamflow. Overall, the detection and attribution analysis showed that the historical changes found in annual total streamflow, center of timing of flow, and summer mean streamflow could be attributed to changing climate and variability.
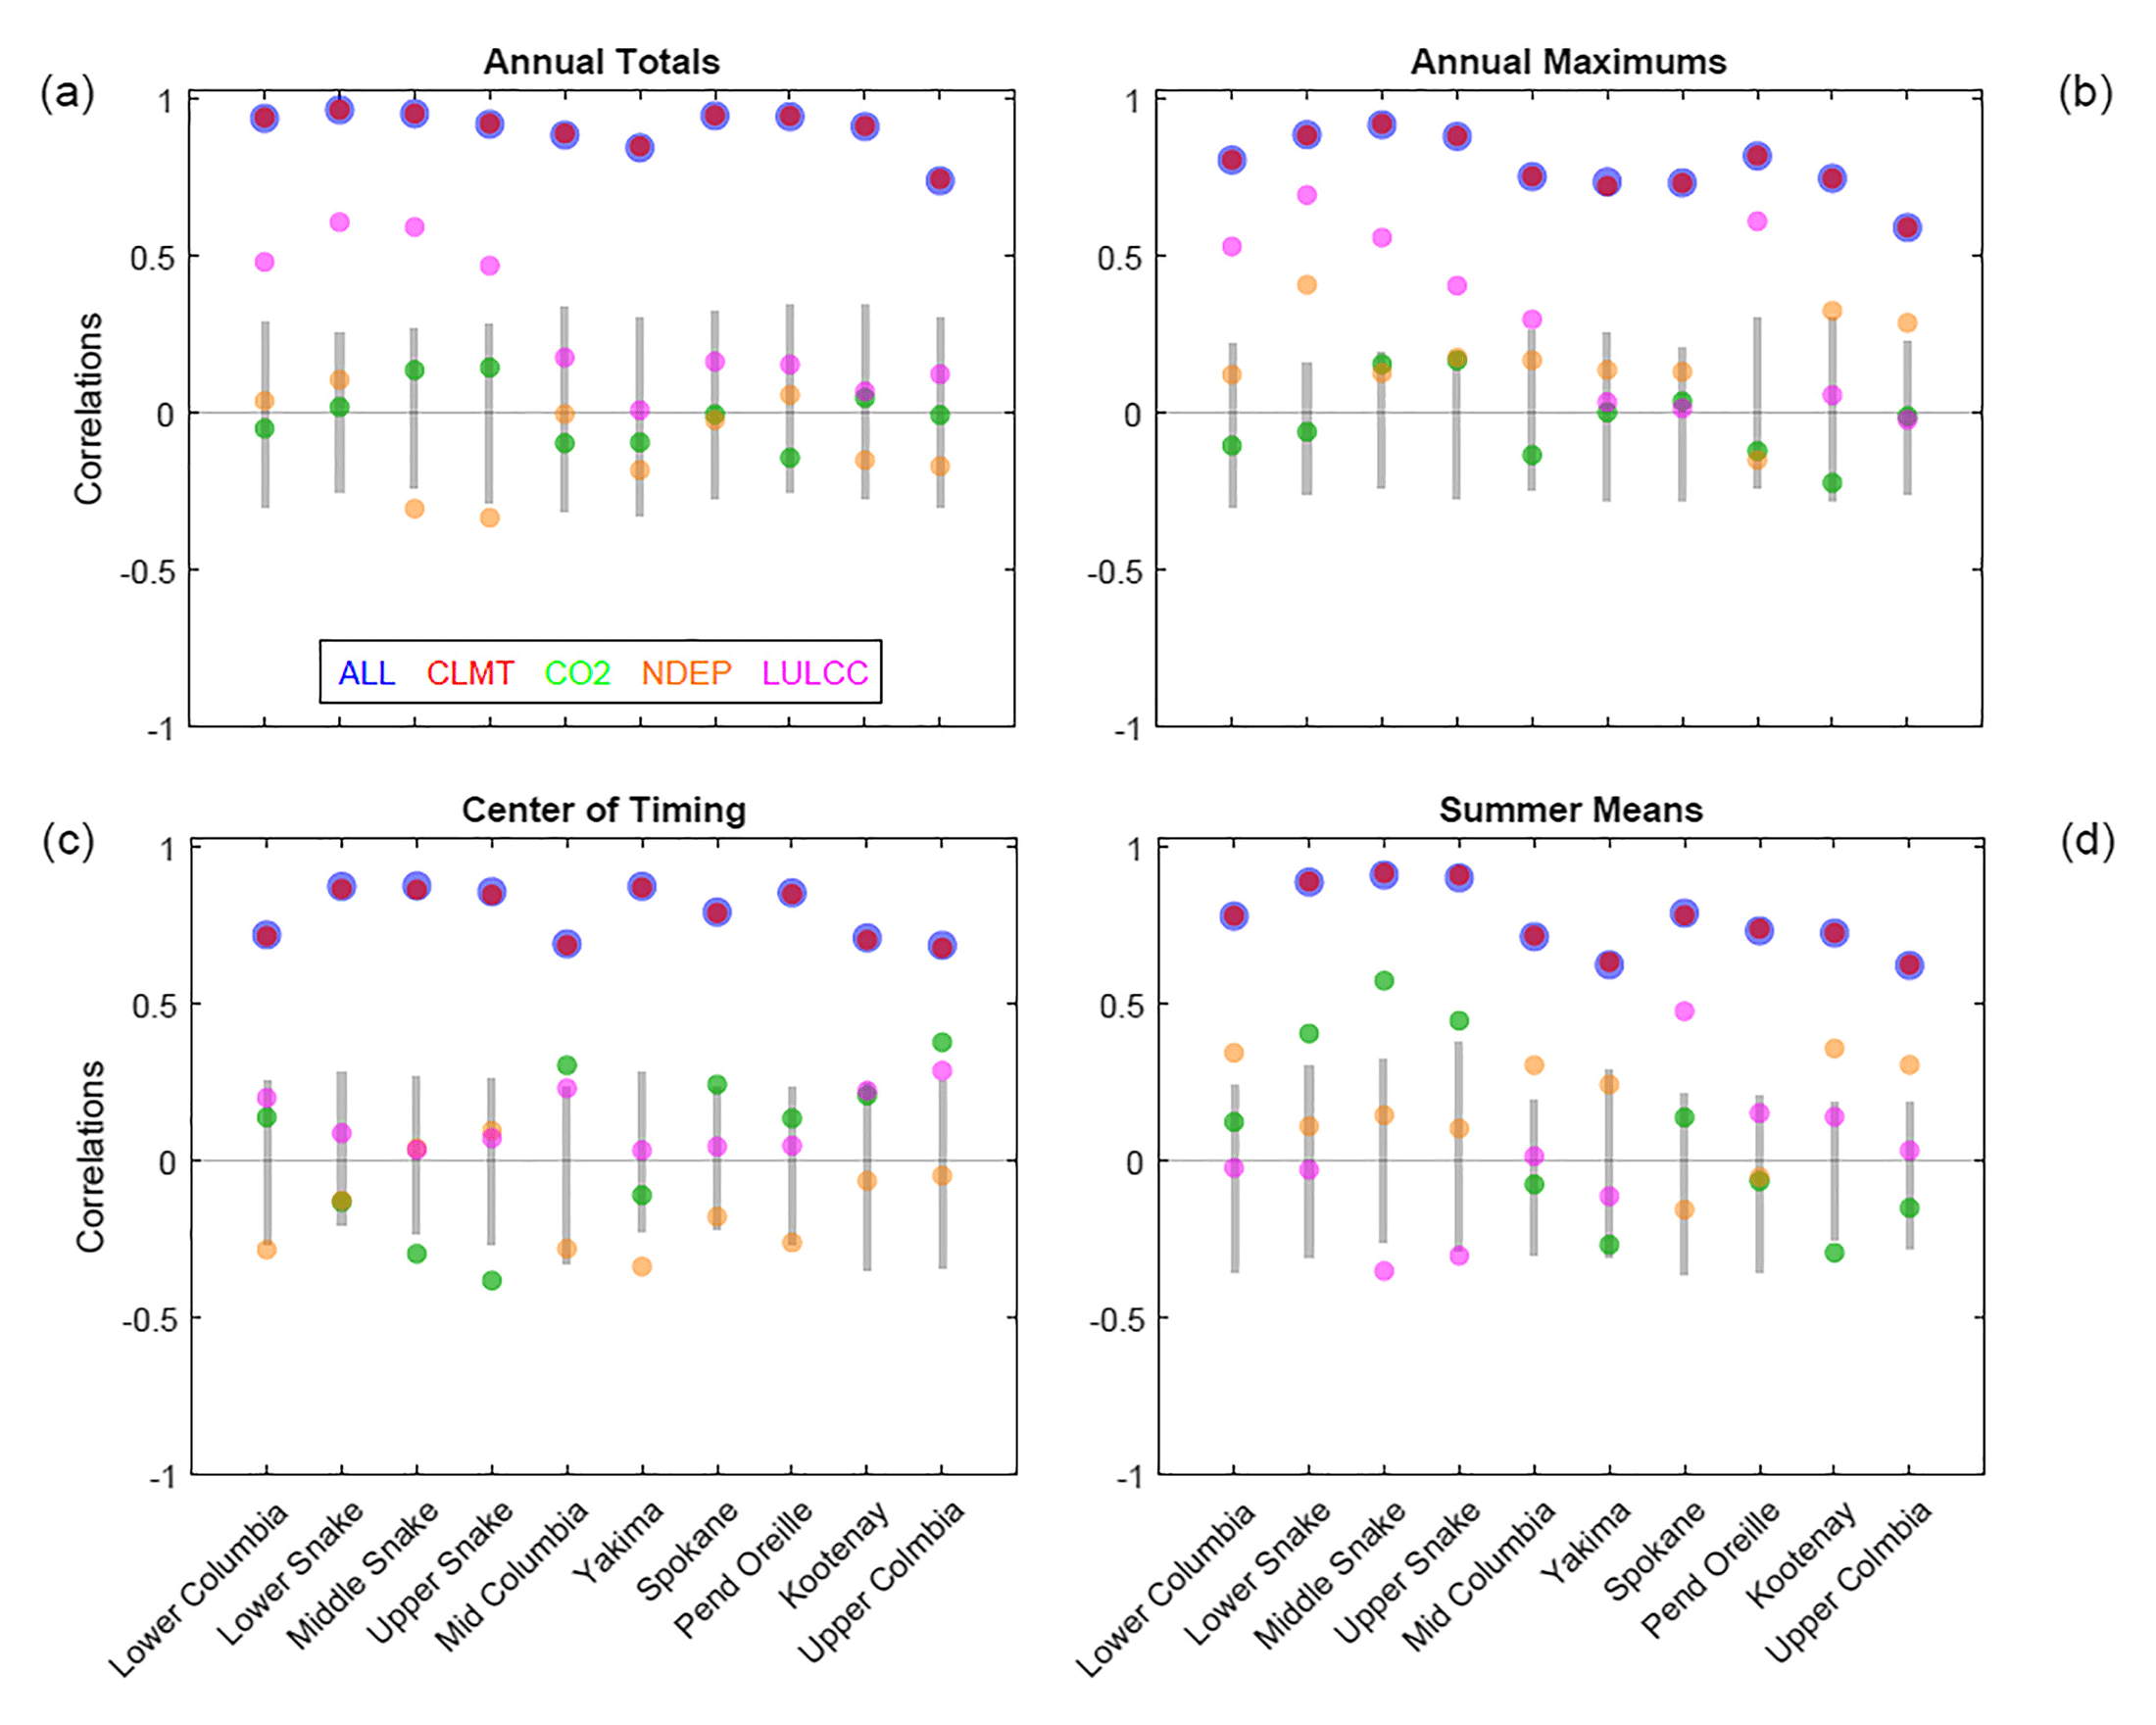
The figure below shows the results of the correlation-based detection analysis, specifically the Pearson correlation coefficients (PCC) between observations and model simulations for the Columbia subbasins. The PCC (shown as “Correlations” in the figure) measures the linear correlation between two variables, for example, observations and the pre-industrial control simulations, in this case. A PCC has a value between -1 and 1, where 1 is a total positive linear correlation, -1 is total negative correlation, and 0 is no linear correlation. The closer to 1, the stronger the correlation; the closer to 0 the weaker the correlation. For correlation-based detection analysis, if the PCC for a driver or forcing (such as climate change) is determined to be greater than the 2.5th-97.5th percentile of the PCC between the observations and pre-industrial control simulations, a detectable change has been identified. In the figure below each vertical grey bar begins at the 2.5th percentile and ends at the 97.5th percentile of the PCC between the observations and the pre-industrial control simulations for each subbasin. A value outside a vertical grey bar is significant (i.e. significantly different from zero) and indicates a detectable external driver or forcing for that subbasin. For all subbasins, climate change alone, as well as all forcings combined, are detectable.

Correlation-based detection and attribution results show that simulations with climate change only (CLMT) and all forcings combined (ALL) behave similarly and show detection of climate change effects for all sub-basins. Land use and land cover changes (LULCC) are detectable for annual totals and annual maximums in a subset of basins. Vertical gray bars show the 2.5th to 97.5th percentiles of the correlations between observations and the pre-industrial control simulations.
Publication
Forbes, W, J Mao, D Ricciuto, S Kao, X Shi, A Tavakoly, M Jin, et al. 2019. “Streamflow in the Columbia River Basin: Quantifying Changes Over the Period 1951‐2008 and Determining the Drivers of Those Changes.” Water Resources Research. https://doi.org/10.1029/2018wr024256.
Contact: Jiafu Mao ([email protected]), Oak Ridge National Laboratory
Funding: This work is primarily supported by the Terrestrial Ecosystem Science Scientific Focus Area (TES SFA) project funded through the Terrestrial Ecosystem Science Program, partially supported by the Reducing Uncertainties in Biogeochemical Interactions through Synthesis and Computing Scientific Focus Area (RUBISCO SFA) project funded through the Regional and Global Climate Modeling Program (RGMA), and partially supported by the Energy Exascale Earth System Model (E3SM) project funded through the Earth System Modeling Program, in the Climate and Environmental Sciences Division (CESD) of the Biological and Environmental Research (BER) Program in the U.S. Department of Energy Office of Science.
Additional References
Barnett, T. P., Adam, J. C., & Lettenmaier, D. P. (2005). Potential impacts of a warming climate on water availability in snow‐dominated regions. Nature, 438(7066), 303–309. https://doi.org/10.1038/nature04141
Fyfe, J. C., Derksen, C., Mudryk, L., Flato, G. M., Santer, B. D., Swart, N. C., Molotch, N. P., Zhang, X., Wan, H., Arora, V. K., & Scinocca, J. (2017). Large near‐term projected snowpack loss over the western United States. Nature Communications, 8(1), 14996. https://doi.org/10.1038/ncomms14966
Hegerl, G.C., O. Hoegh-Guldberg, G. Casassa, M.P. Hoerling, R.S. Kovats, C. Parmesan, D.W. Pierce, P.A. Stott, 2010: Good Practice Guidance Paper on Detection and Attribution Related to Anthropogenic Climate Change. In: Meeting Report of the Intergovernmental Panel on Climate Change Expert Meeting on Detection and Attribution of Anthropogenic Climate Change [Stocker, T.F., C.B. Field, D. Qin, V. Barros, G.-K. Plattner, M. Tignor, P.M. Midgley, and K.L. Ebi (eds.)]. IPCC Working Group I Technical Support Unit, University of Bern, Bern, Switzerland. https://wg1.ipcc.ch/guidancepaper/IPCC_D&A_GoodPracticeGuidancePaper.pdf
Wahl, M., Follum, M., Snow, A., & Tavakoly, A. (2016). Developing hydrologic awareness. The military engineer, 108(700), 65-66. Retrieved from https://www.samenews.org/wp-content/uploads/TME_2016/TME-MarApr2016-Online-SM.pdf


