

VCDAT 2.0 Available
What is VCDAT 2.0 and what does it do?
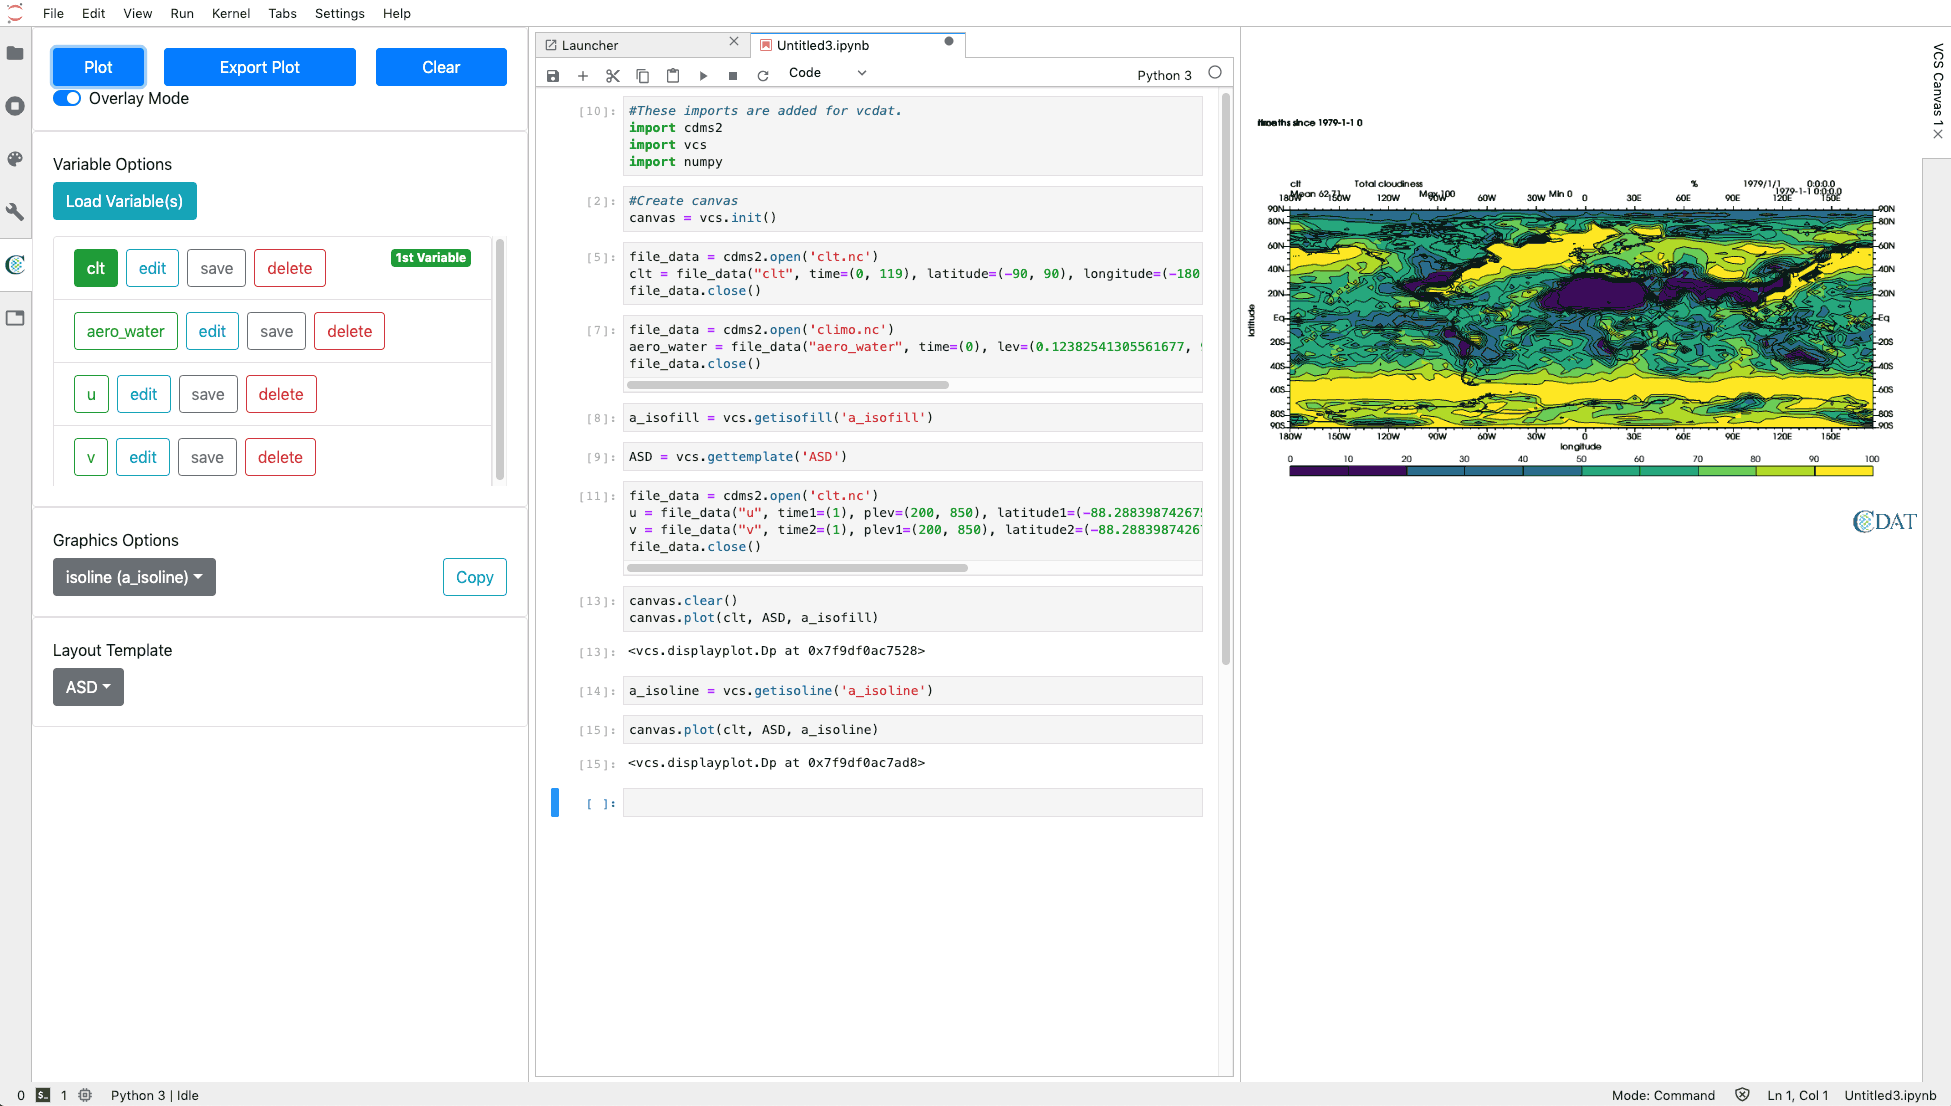
An example of a VCDAT 2.0 notebook session in JupyterLab.
VCDAT stands for Visual Community Data Analysis Tools or Visual CDAT. VCDAT 2.0 is a JupyterLab extension that provides a graphical user interface to CDAT (see image above). Specifically, it allows users to load, manipulate and plot large data sets within Jupyter Notebooks through the tools and libraries provided by CDAT. After just a few clicks, a user with minimal experience in Python or CDAT can easily generate a plot of their data. As a user interacts with the interface to perform an action, the corresponding CDAT command is automatically printed in the Jupyter Notebook, as shown in the middle panel of the image above. This capability allows users to learn how to use CDAT commands effortlessly and allows the Notebook to double as an interactive CDAT tutorial. Advanced users benefit from the built-in Jupyter Notebook Python kernels, which allow users to access the full array of CDAT tools without being limited to the functions provided by the user interface. Users are given the freedom to work seamlessly with a visual interface, the Python code itself, or a mixture of both. One efficient work flow is to test out various CDAT Python commands line by line within a Notebook, make any necessary changes for a given task such as processing a certain type of data file, then export the Notebook to a Python script which can be run directly from the command line in batch mode to process numerous similar files.
Feature Highlights
- Loads variables from various data file formats including: .nc, .cdf, .nc3, .nc4, .ctl, .dic, .pp, and .xml
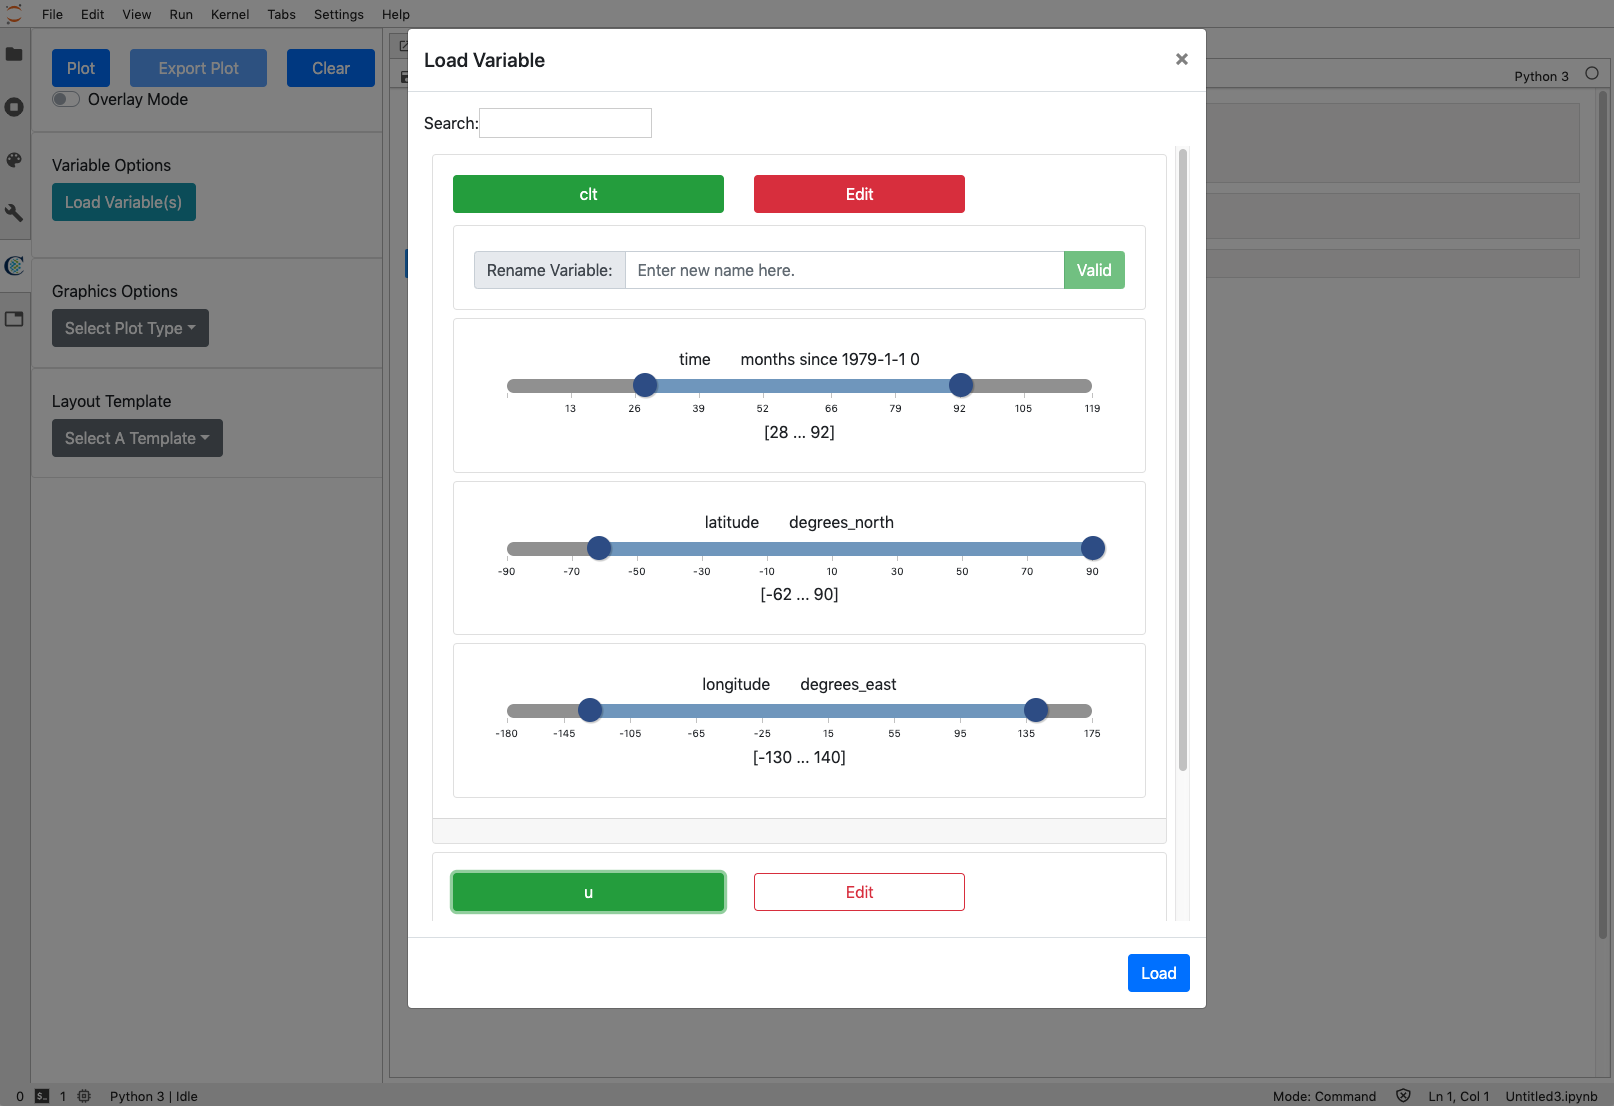
- Allows users to select specific variables and subset their data using sliders before and after loading (see screenshot below).
-

A view of the variable selection window with sliders adjusted to subset data.
- Keeps track of the data variables currently loaded in the Notebook and allows users to edit, rename or delete them.
- Provides a graphics dropdown that lets users select from a range of graphics options for plotting.
- Provides a layout template list that lets users choose a template for their plots.
- Includes a plot button that automatically plots the selected variable using the graphics options and layout template chosen.
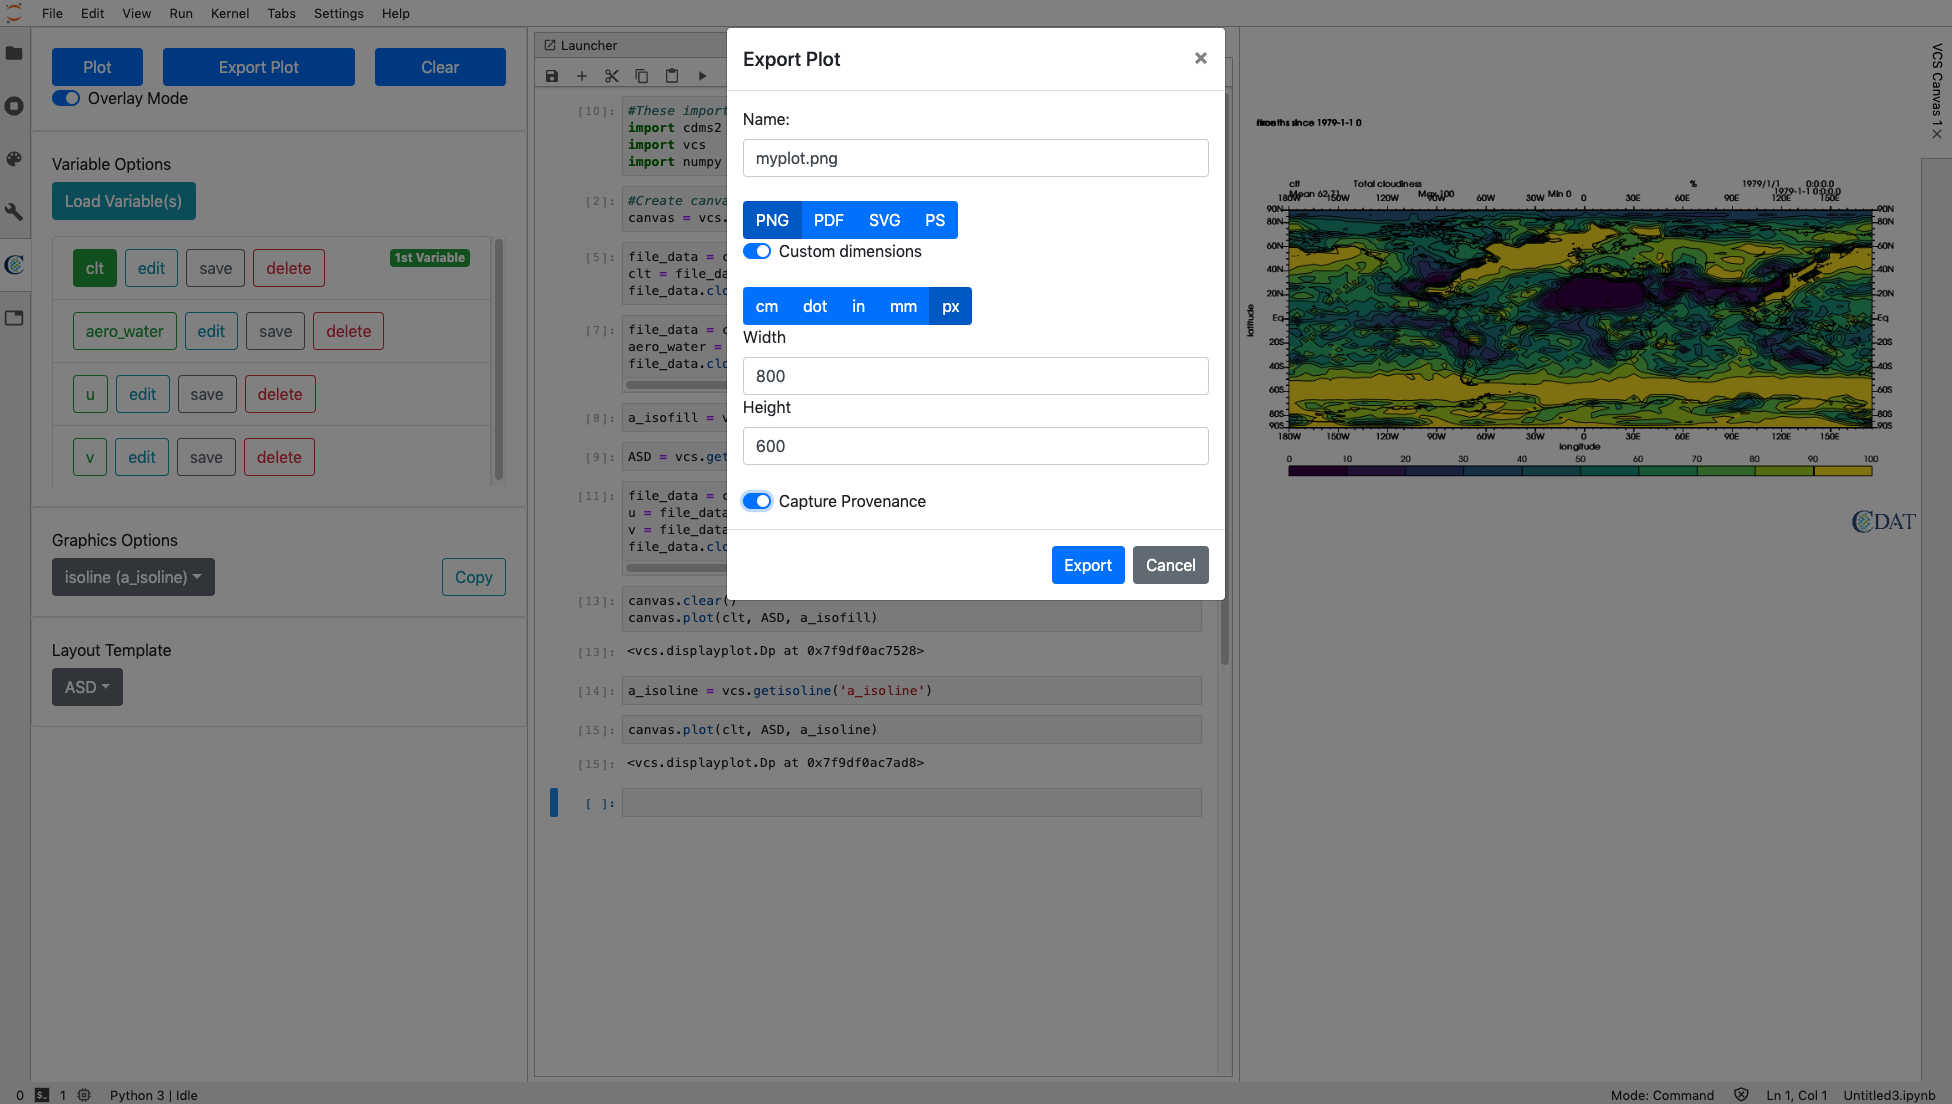
- Provides an export plot dialog box that allows users to save their plots in PNG, PDF, SVG or PS format, with the option of saving the provenance within the PNG format (see image below).
-

A view of the export plot window and available options.
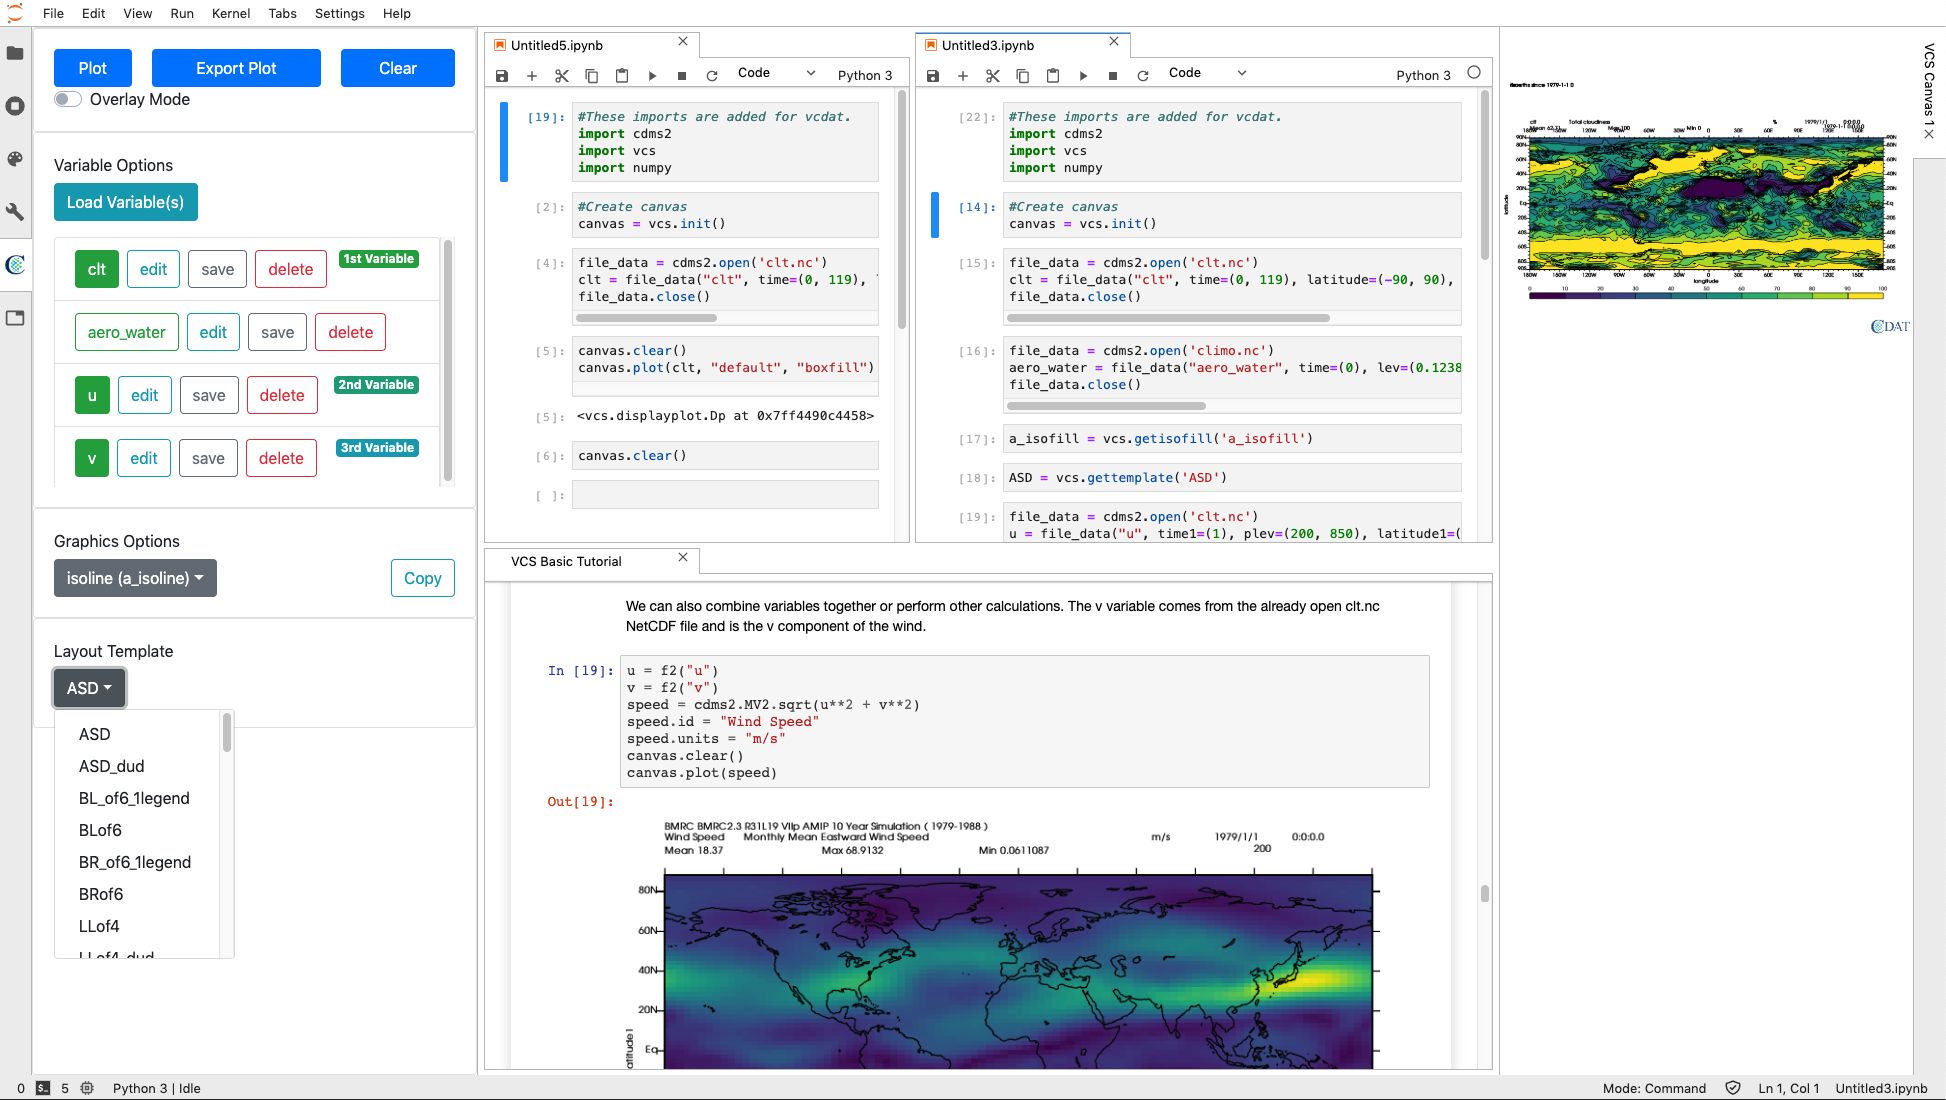
- Includes the ability to work with multiple Notebooks and files at once and switch between them while performing tasks (see screenshot below).
-

An example of multiple Notebooks and files open within the JupyterLab environment.
- Recognizes user-generated cdms2 variables that were created in the Jupyter Notebook itself.
Getting Started
Users have multiple ways to run VCDAT 2.0, including locally in the browser, and on the NERSC JupyterHub instance. Users need to have an account at NERSC to use this second option. Visit the VCDAT Getting Started page for more details.
Goals for the Next Release, VCDAT 2.1
For VCDAT 2.1, the team expects to offer additional features and tools, performance updates, and bug fixes. The improvements planned for the next release include:
- A Colormap Editor feature to allow users to select a colormap for their plot.
- Interactive tours that highlight features and guide new users (see screenshot below).
- Improvements to the user interface to increase responsiveness.
- Backend updates to improve performance and reliability.
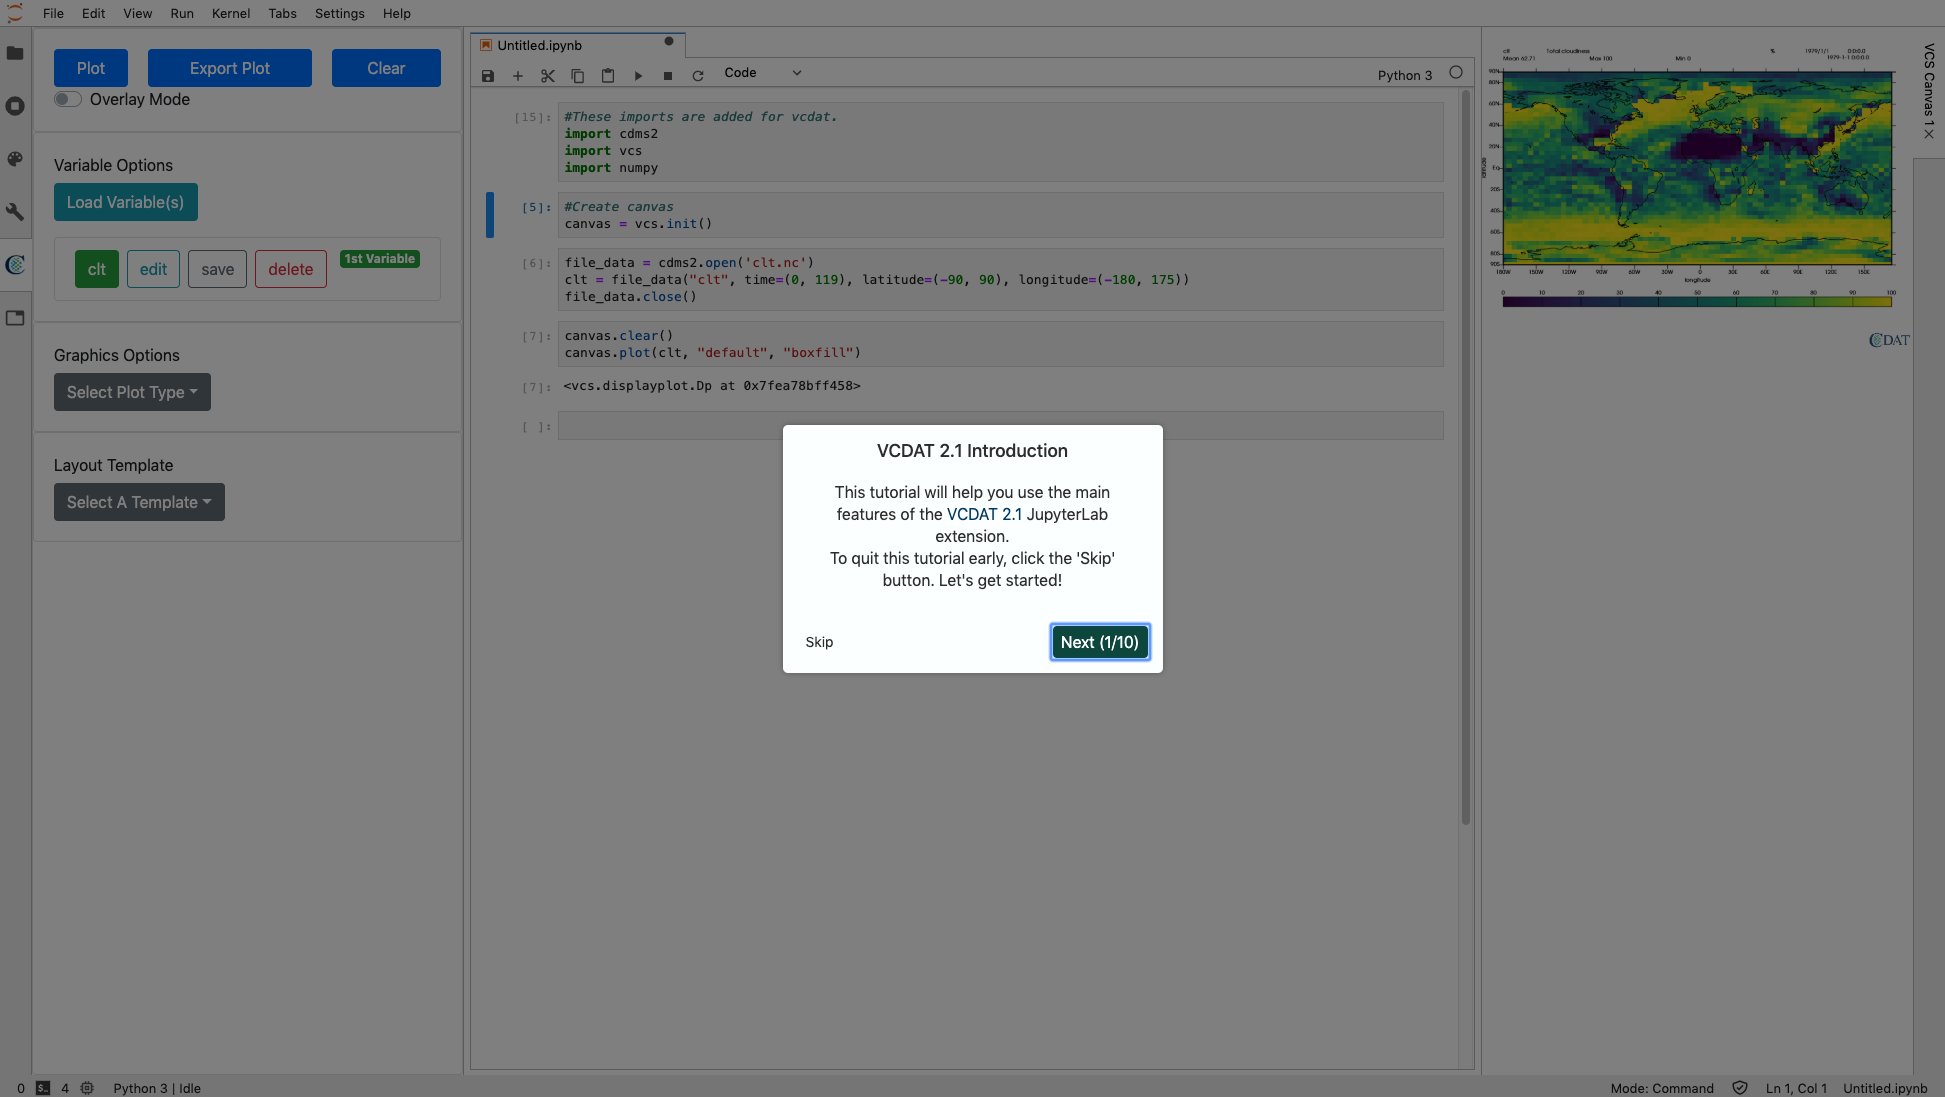
A demo screenshot of the upcoming VCDAT 2.1 interactive tutorials feature.
Credits
This project was funded by the Earth System Grid Federation (ESGF). The VCDAT 2.0 development team is comprised of Carlos Downie, Charles Doutriaux, Sterling Baldwin and William Hill, all from Lawrence Livermore National Laboratory (LLNL). The VCDAT 2.0 documentation team includes Holly Davis (LLNL), Charles Doutriaux and Carlos Downie.