

The Southern Annular Mode in E3SM
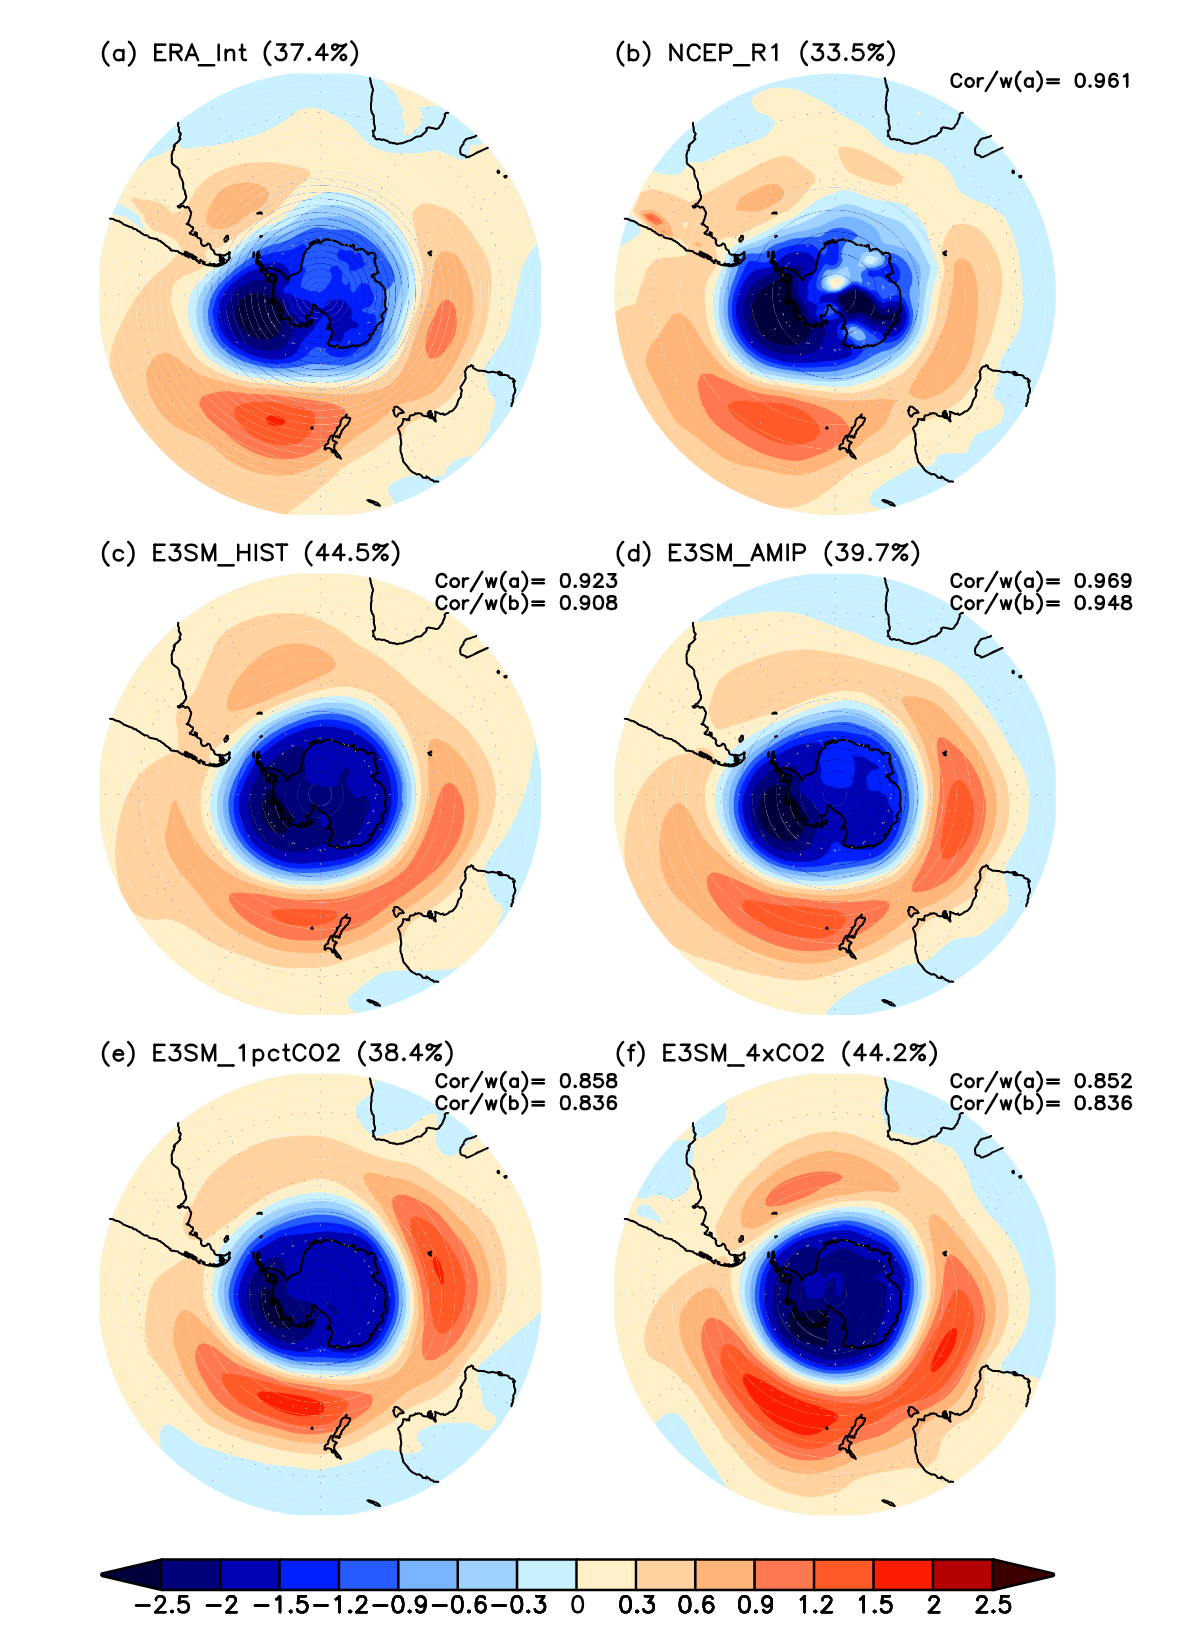
Figure 1: Spatial pattern of the SAM as the leading EOF mode of the annual mean sea level pressure south of 20deg S, obtained from two reanalyses (a) ERA-Int and (b) NCEP-R1, and four E3SM simulations (c) E3SM-HIST, (d) E3SM-AMIP, (e) E3SM-1pctCO2, and (f) E3SM-4xCO2. The numbers above each panel indicate the explained variance. The spatial pattern correlation coefficients against the observed patterns are given at the upper right corner of the panel.
Background
The Annular Modes are hemispheric-scale patterns of climate variability; they are the leading modes of climate variability in the Northern and Southern Hemisphere middle and high latitudes. There are two annular modes in Earth’s atmosphere: a Northern Annular Mode (NAM) and a Southern Annular Mode (SAM). They describe variability in the “anomalous” atmospheric flow, that is, variability not associated with the seasonal cycle. In the pressure field, the annular modes are characterized by north-south shifts in atmospheric mass between the polar regions and the middle latitudes.
The Southern Annular Mode (SAM), which is also referred to as the Antarctic Oscillation, has strong effects on the climate systems at high and middle latitudes of the Southern Hemisphere (SH). The SAM displays a seesaw pattern for the atmospheric mass (sea level pressure or geopotential heights) in extratropical regions over the SH. The positive phase of the SAM is characterized by lower anomalous air pressure over the Antarctic along with higher anomalous pressure over the middle latitudes. This causes changes in the strength and position of the westerly winds. In the positive SAM phase, the westerly winds are stronger and move poleward, while the westerly winds weaken in the negative phase and move toward the equator. In positive phase of SAM there is generally more rain in the eastern Australia as well as lower rainfall and higher temperatures in western New Zealand and the opposite is true in the negative phase ( for more details check SAM and Australian Climate and SAM and New Zealand Climate). SAM causes variations in temperatures over Antarctica, sea-surface temperatures throughout the Southern Ocean, and the distribution of sea-ice around the perimeter of Antarctica. It has been shown that SAM is exhibiting positive phase trends attributed to stratospheric ozone depletion, causing cooling of the main Antarctic continent while Antarctic Peninsula was warming.
This research focuses on assessing the E3SM model ability to reproduce climate variability and trend in the SAM and Southern Hemisphere surface zonal wind stress.
Approach and Results
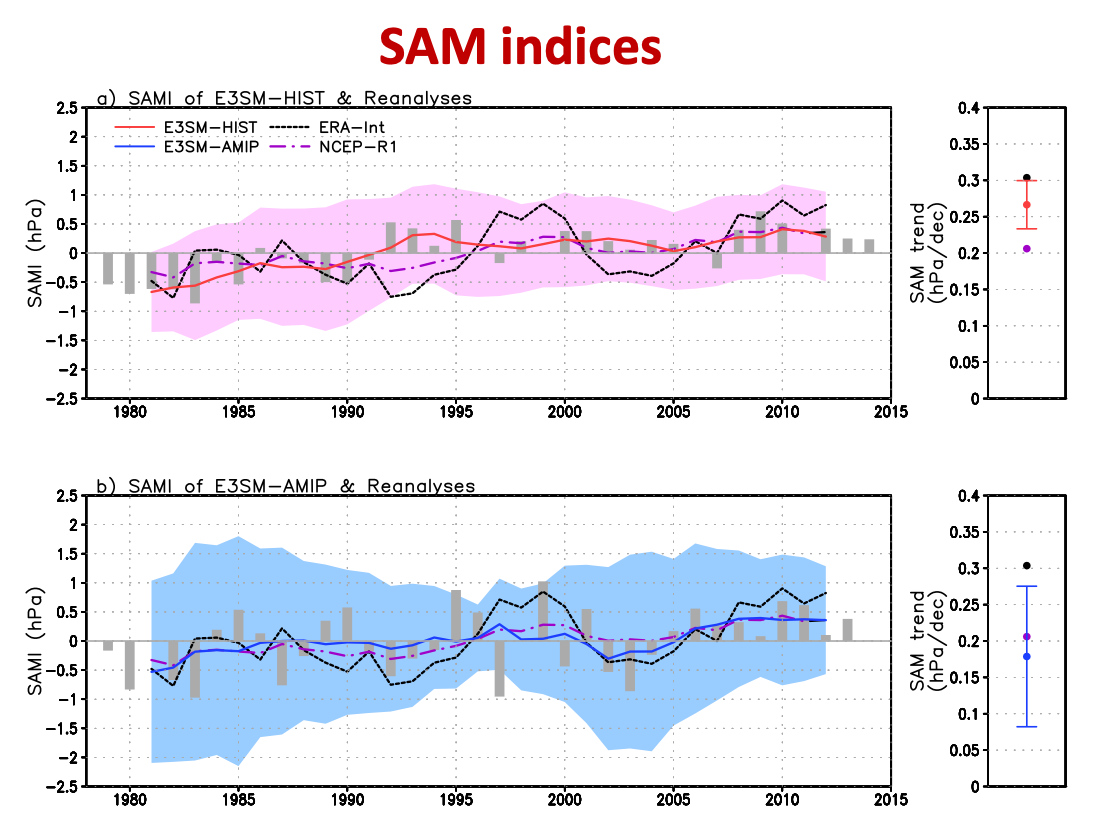
Figure 2: Annual mean SAM index (gray bar) and the 5-yr running average (lines) defined as the corresponding time series of the 1st EOF mode. Trends (circles) in the annual mean SAM index are shown in the right panel. Shaded areas and error bars are the 95% confidence intervals about the E3SM-HIST (a) and E3SM-AMIP (b) ensemble means.
The variability and trend in the SAM and position and strength of the surface zonal wind stress were investigated using two ensembles of simulations covering the historical period from the Energy Exascale Earth System Model (E3SM-HIST and AMIP) for 1979–2014. The historical simulations (E3SM-HIST) can be used to better understand climate change arising from the combination of natural forcing, anthropogenic forcing, and unforced variability while the E3SM-AMIP simulations, constrained by the observed sea surface temperature and sea ice concentration, are useful for the evaluation of the skill of the atmospheric model component. In addition, the performance of two CO2 forcing simulations from the E3SM (E3SM-1pctCO2 and 4xCO2) is assessed to examine the sensitivity of the variability and changes in the SAM and SH surface zonal wind stress to climate forcing.
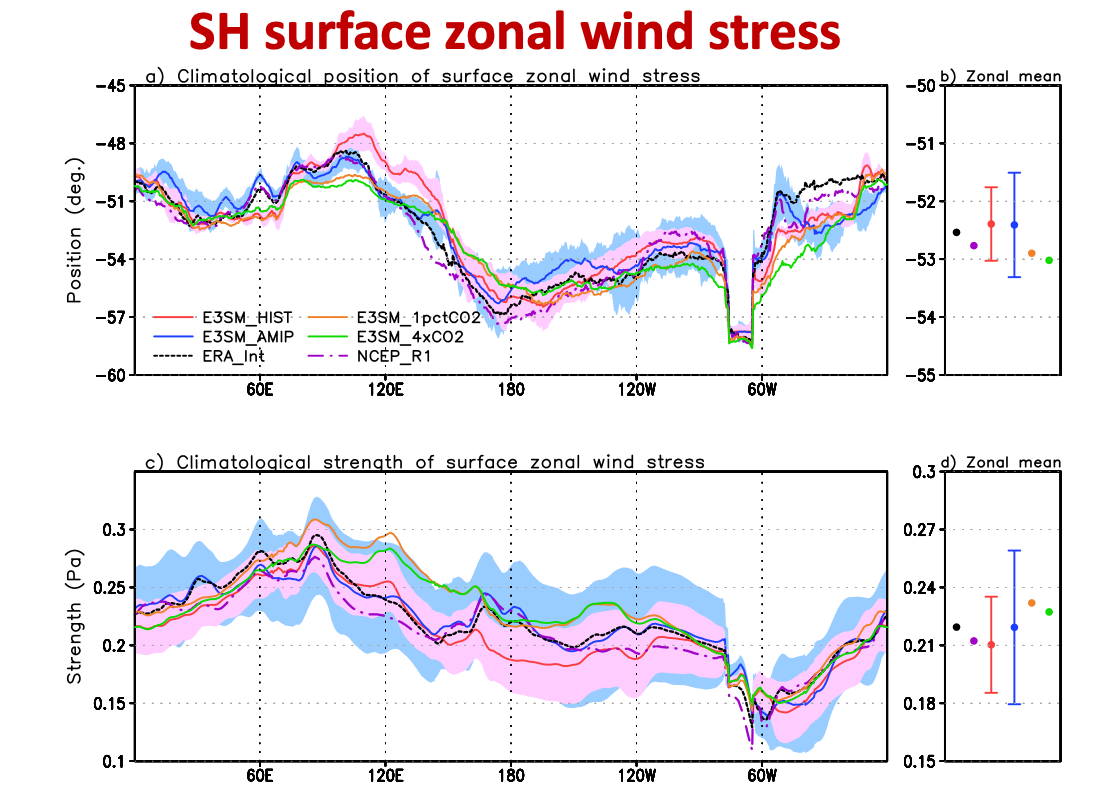
Figure 3: Climatological (a) position and (c) strength by longitude of the annual mean surface TAUX over the Southern Ocean and (b, d) their zonal mean. The shaded areas and error bars represent the 95% confidence intervals about the E3SM-HIST (red) and E3SM-AMIP (blue) ensemble means.
In general, all E3SM simulations are able to capture the dominant feature of the SAM pattern reasonably well (Fig. 1). The E3SM-HIST and AMIP simulations show similar intensity in the strongest positive and negative centers compared to the observations and indicate lower center intensity than the two CO2 simulations (E3SM-1pctCO2 and 4xCO2). As noted by many studies showing positive trend in the SAM over the recent historical periods, the HIST and AMIP simulations of the E3SM model have successfully reproduced the positive SAM trends that is significant at 95% confidence level. The time variability of E3SM-AMIP simulation has a very close relationship with the two reanalyses, showing a considerably high and significant correlation coefficients of 0.753 with ERA-Int and 0.816 with NCEP-R1. The SAM index variability is closely associated with the variability in the position and strength of surface zonal wind stress. The annual SAM index in the E3SM-HIST simulation shows a significant increasing trend (Fig. 2), which is largely consistent with the observations. These features are similar to the trends in the strength (along with the poleward shift in the position) of the annual surface zonal wind stress. For the climatological surface zonal wind stress position and strength (Fig. 3), the single member of the two CO2 forcing simulations show slightly poleward movement and stronger intensity, while the ensemble mean of E3SM-HIST is slightly equatorward and weaker than observations. At least for E3SM-HIST and AMIP, the climatological means of zonal wind stress position and strength are within uncertainty ranges relative to the observations. The stronger responses in the CO2 experiments are likely because during the analysis period (last 36 years of the 150 year simulations), the CO2 forcings exerted are much stronger than in the E3SM-HIST and AMIP simulations. These E3SM simulations, especially the E3SM- HIST and AMIP simulations provide useful information to better understand the atmospheric variability and ocean circulation in the SH through diagnostic evaluation of the SAM and surface zonal wind stress and their co-variability
Impact
Since Annular Mode (AM) and surface zonal winds have strong effects on the atmospheric and oceanic circulation system and climate change, in order to assess model fidelity, one must consider the model’s ability to reproduce annual mode characteristics and position and strength of the surface zonal wind stress. This study shows that the E3SM model has reasonable skill in capturing the dominant features of the SAM mode and the response to external forcing, lending confidence in using E3SM to aid the research of the atmospheric variability and ocean circulation in the SH and study the global impact of the disruption to the SH polar climate and the cryopshere system with the SAM as the critical link.
Paper
Lee, D, MR Petersen, and W Lin. 2019. “The Southern Annular Mode and Southern Ocean Surface Westerly Winds in E3SM.” Earth and Space Science 6 (12): 2624-2643. https://doi.org/10.1029/2019ea000663.
Contact
Doo Young Lee
Los Alamos National Laboratory
Funding
Program
Project