

Scientists Take on Colossal CMIP6 Data Analysis Challenge
Global earth system modeling is a complex science. In addition to observation, theory, and computer science, modeling involves model output “data”—a lot of data.
A massive task for scientists contributing to the Coupled Model Intercomparison Project (CMIP) is not only dealing with the vast quantities of data, but integrating activities across the project and organizations as they collaborate to analyze and compare simulation output from modeling centers around the world.
In the case of the current phase, CMIP6, international research organizations simulated the same historical and future climate scenarios with their own earth system models. “We have 40 different models with each doing 20 to 30 simulations,” explained Wilbert Weijer, an oceanographer at Los Alamos National Laboratory (LANL). “By comparing these different models and how they simulate the same scenarios, we can measure how robust—or uncertain—the projected outcomes are.”
These outcomes—documented in the form of published papers—will be available for the landmark Sixth Assessment Report of the Intergovernmental Panel on Climate Change (IPCC). The report is expected to be published in 2021.
CMIP6 Background and Objectives
Nathan Collier, a computational earth system scientist at Oak Ridge National Laboratory, evaluates CMIP6 model soil carbon turnover times while researchers at other locations work on their own analyses.
With oversight by the World Climate Research Programme (WCRP), CMIP is a collaborative framework designed to improve knowledge of changes in the earth system arising from natural, unforced variability or in response to changes in radiative forcing. This understanding includes assessments of model performance during historical periods and quantifications of future projections.
CMIP is developed in phases and contributes to the improvement of earth system models by documenting differences between models and between models and observations. It also informs the Intergovernmental Panel on Climate Change (IPCC) Report. CMIP6 aims to analyze and improve upon participating international models, including wider distribution and characterization of model outputs, common data sets, and standard tools for analyses and documentation.
CMIP6 data is distributed through the Earth System Grid Federation (ESGF), a peer-to-peer system based at Lawrence Livermore National Laboratory (LLNL) that develops, deploys, and maintains software infrastructure for the management, dissemination, and analysis of model output and observational earth system data.
The Department of Energy’s (DOE’s) Program for Climate Model Diagnosis and Intercomparison (PCMDI) science focus area (SFA), managed by LLNL, supports CMIP by maintaining the project’s database and by participating in data analysis.
Rising to the Challenge
With the IPCC’s hard deadline to submit papers just months away, DOE’s Regional and Global Model Analysis (RGMA) program area scientists took an innovative path to overcome a “huge challenge,” says Weijer, who leads the HiLAT-RASM (High-Latitude Application and Testing of Earth System Models-Regional Arctic System Model) SFA, funded under the RGMA program area.
“Several SFA teams have been doing CMIP intercomparisons and analysis on a regular basis,” Weijer explained. “With the anticipated massive influx of data from international models, RGMA leadership suggested a ‘hackathon’ to bring RGMA scientists together and address a huge data challenge.”
“In the past, it would take months to find, download, organize, and then analyze large data sets like this. But now, it took just a week or two because of the centralization of data and analysis tools.”
— William Boos, University of California, Berkeley
At the core of the hackathon was the concept that if petabytes of the most frequently analyzed model results and corresponding observational data could be downloaded to one high-performance computing platform, then team members could log on, work with the data, and focus on analysis rather than spend hours upon hours downloading data.
The RGMA effort was organized by different leads, with Weijer taking on the role of organizing the overall effort—bringing together the RGMA community and organizing virtual activities. Meanwhile, Forrest Hoffman, a computational earth system modeler at Oak Ridge National Laboratory (ORNL) and a lead scientist of the RUBISCO (Reducing Uncertainty in Biogeochemical Interactions through Synthesis and COmputation) SFA worked behind the scenes to prepare the data for the hackathon teams.
Starting in April 2019, Hoffman began downloading available CMIP6 model results and working closely with the research teams—spread across LANL, ORNL, Lawrence Berkeley National Laboratory (LBNL), LLNL, Pacific Northwest National Laboratory (PNNL), the University of California system, the University of Washington, and others—to identify additional output they needed from the international simulations.
Hoffman put in long hours for more than a month to ensure that that petabytes of the most commonly needed data were accurately loaded on DOE’s National Energy Research Scientific Computing Center (NERSC) machines in the desired configurations and ready for the July 31 to August 6, 2019 hackathon.
In the lead-up to the hackathon, a series of webinars, tutorials on software products, and presentations readied the scientists who agreed to participate. In particular, a four-hour tutorial on DOE’s Community Data Analysis Tool (CDAT) software was prepared and given by LLNL computer scientist Charles Doutriaux. “All this preparation was invaluable because it meant that once we were at the hackathon, people had a foundational understanding and could spend the next five days working on the data and focusing on science results,” says Hoffman.
Paul Ullrich, a professor at the University of California, Davis and lead of the HYPERFACETS project, worked with NERSC for computing resources to secure 2.5 petabytes of data storage on NERSC’s high-performance computers and downloaded much of the reanalysis data used to benchmark model performance. “The fact that NERSC stepped forward in collaboration and provided this needed data space drove this project forward and ultimately helped make it a success,” says Weijer.
Michael Wehner, a scientist at Lawrence Berkeley National Laboratory (LBNL), was responsible for the computational performance of the analysis software and took responsibility for making high-resolution data available to the effort.
Analyzing the Data
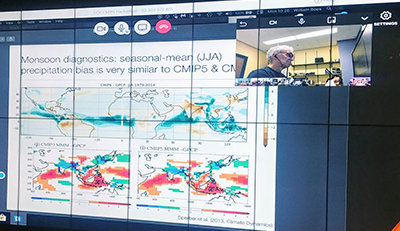
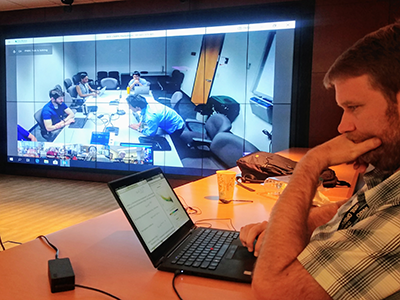
PNNL atmospheric scientist Phil Rasch (upper right) analyzes atmospheric model results while UC Berkeley associate professor William Boos presents monsoon diagnostics from CMIP6 results compared with those from CMIP5 models.
Drawing inspiration from similar activities that are common in the software community, the RGMA CMIP6 hackathon was the first event of its kind in the context of CMIP. It revolved around six ‘hubs’ across the country where scientists could collaborate in a focused setting. Researchers at the hubs were in contact through teleconferencing capabilities, and Github was used to exchange analysis scripts. Roughly 100 scientists participated in the greater analysis activity, while an estimated 50 scientists participated in the hackathon at any given time.
Each day of the event, all work would stop at 1 p.m. Eastern time for a series of presentations from each team, from coast to coast. Updates on progress and lessons learned were shared with other participants, and to further encourage open communication, a Slack channel (a cloud-based collaboration hub) was established to answer questions and cultivate collaboration.
The coordinated CMIP6 analysis activity allowed a large number of users to make rapid progress on meaningful science using the CMIP6 archive. “In the past, it would take months to find, download, organize, and then analyze large data sets like this,” says William Boos, an associate professor at the University of California, Berkeley. “But now, it took just a week or two because of the centralization of data and analysis tools.”
Ruby Leung, an atmospheric scientist at PNNL, adds, “The hackathon was very helpful because of the significant efforts invested in preparing the data and software packages needed for analysis of the CMIP6 simulations. Seeing the variety of analysis performed by different teams during the hackathon has stimulated new ideas for collaborations.”
Meeting Objectives
“For me, this was really a satisfying collaboration,” says Weijer, explaining how the hackathon met the organizer’s three objectives: To make the data accessible, to develop a common analysis tool, and to bring the RGMA research community together.
- Objective1—Build a Data Repository: The team downloaded a significant fraction of the CMIP6 data set to one central high-performance computing platform where all researchers could access and analyze the data in a single environment. “This not only saved time but built upon collaborations with NERSC,” says Weijer.
- Objective 2—Build a Common Analysis Environment: Because the analysis of data can be quite tedious, with annual averages of data sets all processed the same way, there was a desire for a common analysis tool that would not only make the process more efficient but allow hackathon participants to share expertise. Software developers from LLNL stepped forward with CDAT. Participants were given a comprehensive tutorial and presentation before the start of the hackathon. According to Weijer, CDAT works well with the JupyterLab capability of NERSC, and can easily be extended with Python-based analysis.
- Objective 3—Build a Community of Scientists: With hundreds of scientists working at scores of research institutions across the country, bringing the RGMA community together is an ongoing challenge. In the context of the hackathon, several RGMA SFA teams were familiar with this type of model analysis, but not all. By bringing everyone into virtual rooms, expertise was shared openly, and processes were made more efficient.
Looking Ahead
According to Hoffman, the person-to-person nature of the hackathon eliminated repetition and improved the quality of the analysis. “In addition to building community, the hackathon has created a path forward for future collaboration,” he says. “Working with others creates familiarity, and familiarity builds trust and teamwork.”
Added Weijer: “We have contributed to a collective understanding of climate variability and change, and as a result, the research community will be better prepared to quantify the uncertainties that are inherent in climate projections. With lessons learned,” he concluded, “we hope to organize similar activities in the future, including an even larger user base.”
Acknowledgement
This story is republished with permission. It originally appeared on the website of Earth and Environmental System Modeling (EESM), a research area for the Climate and Environmental Sciences Division (CESD) of the Office of Biological and Environmental Research (BER) within the U.S. Department of Energy’s Office of Science.