

Integration of ARM Diagnostics into E3SM Diags
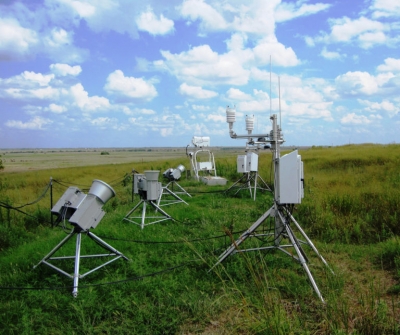
Radiometers at ARM’s Southern Great Plains atmospheric observatory. Image courtesy of the U.S. Department of Energy’s Atmospheric Radiation Measurement (ARM) user facility.
Background
The U.S. Department of Energy’s Atmospheric Radiation Measurement (ARM) user facility provides high-frequency, long-term in-situ measurements that are invaluable in developing and improving climate models. A metrics and diagnostics package called ARM-Diags was developed to further facilitate the use of ground-based ARM measurements in evaluating climate models. With growing interest in improving parameterizations using process-oriented metrics and diagnostics, ARM observations play an important role in the way cloud and precipitation processes are represented in climate models.
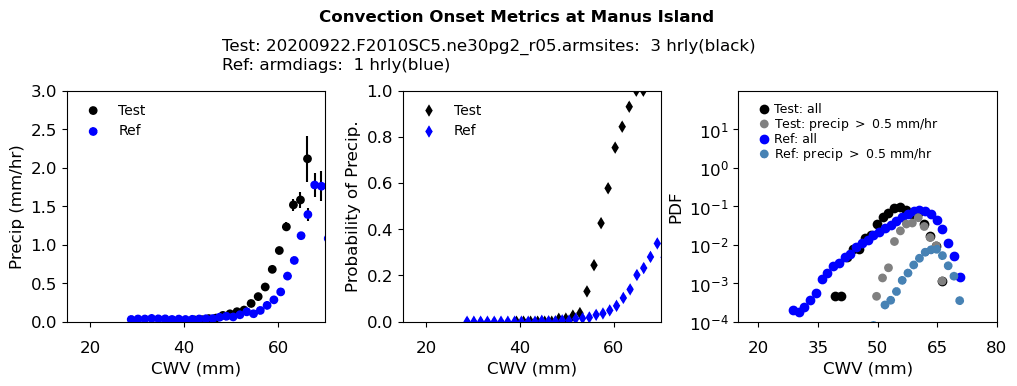
Figure 1. Left: Precipitation conditionally averaged on column water vapor (CWV) for observations based on ARM Best Estimates (ARMBE) precipitation and gap filled MWRRET radiometer CWV (blue) and a one year E3SM model output (black) over Manus Island in northern Papua New Guinea. Middle: precipitation probability (the number of CWV observations with rain rates greater than a small threshold, here 0.5 mm/hr, divided by the total number of CWV samples in each bin). Right: The PDFs of CWV for observations (dark blue) and model (black) and of the contribution to this from points with precipitation exceeding 0.5 mm/hr for observations (light blue) and model (grey).
E3SM-Diags is a Python-based diagnostics package developed within the E3SM project and used routinely in E3SM development. Most diagnostics suites in E3SM-Diags have focused so far on global analysis. Incorporating comprehensive analyses using observations from selected ARM locations from different climate regions will complement current evaluation capability. Hence, the upcoming E3SM-Diags new release (v2.4.0) integrates ARM-Diags, allowing users to routinely test E3SM output at multiple ARM stations against climatology and time-series files generated from ARM data. Some features from ARM-Diags have already been used in development of E3SM’s physical parameterization.
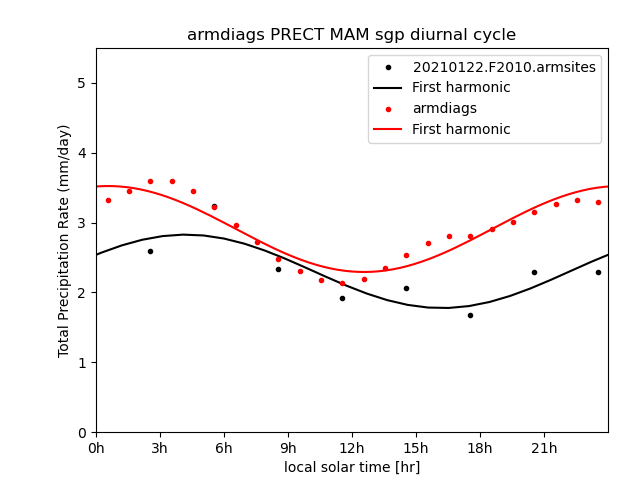
Figure 2. Diurnal cycle of March-April-May mean at the South Great Plains Site, comparing a one year experimental run with 3-hourly output (Black) and hourly ARM data (red). Solid lines are first harmonics of the composite diurnal cycle.
The v2.4.0 E3SM-Diags release includes the seasonal mean and annual cycle of a range of atmospheric variables from ARM observations including surface air temperature, precipitation, radiation fluxes and surface turbulent fluxes, the metrics of convective onset (Fig. 1), and the diurnal cycle of both cloud fraction and precipitation (Fig. 2). These diagnostics will be run routinely to help the E3SM team evaluate the model’s convection schemes and particularly to understand how the parameters and related physical processes are represented in the model.
Acknowledgements
This work is conducted by the ARM infrastructure team at LLNL and the E3SM-Diags team, jointly supported by DOE’s ARM and ESMD programs. Special thanks to David Neelin’s group at UCLA who provided the convection onset diagnostics and Wuyin Lin at BNL who helped finalize the E3SM model configuration and tested its capability for limited region output.
References and Related Links
- ARM Diagnostics
- E3SM Diagnostics
- E3SM Diagnostics Adds ENSO Analysis
- E3SM Diagnostics v1.5.0
- Atmospheric Radiation Measurement user facility – ARM
- Atmospheric System Research – ASR