

Cloud Deck Spatial Errors in the E3SMv1 Atmosphere Model
Marine low‐level clouds are a critical element in the Earth’s energy balance. However, these marine atmospheric boundary layer (MABL) clouds continue to be poorly simulated in global-scale models despite many studies and field experiments devoted to their improvement. In Brunke et al. (2019), the authors focused on spatial errors in the low-level cloud decks (Figs. 1 and 2) in the Department of Energy’s Energy Exascale Earth System Model (E3SM) relative to the satellite climatology. For the first time, scientists quantified the spatial errors using object‐based metrics developed by the numerical weather prediction community. They investigated the cause of the errors associated with deficiencies in the model’s dynamics (i.e. large-scale motions that are resolvable at the gridcell level), the model’s physical process representations (referred to as “model physics”, which are parameterizations to estimate small-scale processes), and the interactions between the two.
Approach
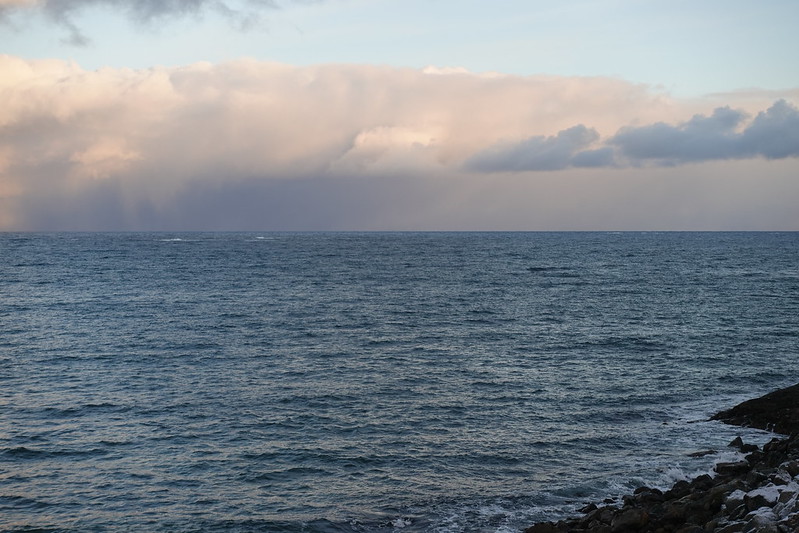
Figure 1. Marine atmospheric boundary layer (MABL) cloud deck (i.e. cloud layer). Image courtesy of the U.S. Department of Energy Atmospheric Radiation Measurement (ARM) Research Facility.
The authors used model simulations with different configurations including (1) the fully coupled E3SM; and (2) the E3SM Atmosphere Model Version 1 with (a) free‐running dynamics; and (b) with constrained meteorology, where the model winds are nudged toward those of the Modern Era Retrospective Analysis for Research and Applications Version 2 (MERRA‐2). All of these runs are on the low‐resolution grid (~100‐km horizontal grid spacing).
The low cloud cover (LCC) simulated by E3SMv1 is compared with three models (CESM1, GFDL CM3, and GISS MOdelE2) from other U.S. climate modeling centers that participated in the Coupled Model Intercomparison Project Phase 5 (CMIP5) and satellite observations. The Cloud Feedback Model Intercomparison Project Observation Simulator Package (COSP) is used for fair model-to-observation comparison. The authors focused on the subtropical low cloud decks, limiting their analyses to 30° latitude × 35° longitude boxes off the west coasts of continents in the Pacific, Atlantic, and Indian Oceans that encapsulate all or most of the cloud decks.
Quantification of Spatial Errors in Cloud Decks
To quantify the spatial errors in the simulated cloud decks, three object-based metrics were used to evaluate simulated features. The authors measured location errors of the simulated cloud decks by calculating the distance between the centroid of the simulated deck and that of a satellite data product, GCM‐Oriented CALIPSO Cloud Product (GOCCP) for each season in each region. They also measured model deficiency in the size of the simulated cloud decks as compared to the satellite climatology. The combined effects of location, size, and shape errors were measured by the overlap ratio – the ratio of the overlap area to the area of the union of the simulated and observed decks. These three metrics provide insights into the characteristics of the MABL clouds in E3SMv1.
Figure 2. The GOES-17 (GOES-West) satellite spied these marine stratocumulus clouds (MSCs) off the West Coast on April 10, 2020. The clouds typically form over water and have either closed-cell (~100% cloud cover) or open-cell (broken) forms. This video shows both, and offers a view from above of the cloud deck over the western Pacific. Video courtesy of NASA/CIRA.
Reasons for Cloud Deck Spatial Errors
Lower tropospheric stability (LTS), which measures the difference between the potential temperature of the free troposphere (700 hPa) and the surface, has long been used as a metric of the strength of the inversion at the top of the MABL, which increases under more subsidence. Under greater subsidence, the MABL top is pushed down, making the low stratiform clouds spread out and increasing LCC. Hence, one possible cause for the MABL cloud bias is the model deficiency in simulating the large-scale dynamics.
The authors find that LTS in E3SMv1, and in most models, agree well with the LTS from the ERA‐Interim reanalysis values in the extended regions (Figs. 3a and 3b). Likewise, the modeled 700‐hPa vertical velocities (Figs. 3c and 3d) are close to the ERA-Interim reanalysis values (black dots in Figs. 3a-3d). The generally good agreement between E3SMv1 and the ERA-Interim reanalysis data for the LTS and vertical velocities suggest that the model dynamics associated with large‐scale subsidence are well-simulated by the model. Hence, the model dynamics is not the primary cause of the spatial errors in the modeled cloud decks, but these errors can be caused by model physics or interactions between physics and dynamics.
To address the role of deficiencies in model physics versus those due to the interaction between the large‐scale dynamics and physics in E3SMv1, the authors performed a different type of sensitivity test in which the model winds were nudged to that of MERRA‐2. In the nudged simulation, the model’s physics-dynamics interactions are limited. The authors found that there was more LCC in the nudged run closer to the coasts and less LCC further away from the coasts (Figs. 3e and 3f). Similar changes are found in liquid water path as well. Increased LCC in the nudged run is associated with slightly stronger increases or weaker decreases in subsidence depending on the region. The improvement in the simulated LCC in nudged runs (third row; Figs. 3e and 3f) suggests that the model LCC bias is primarily due to the interaction between the model dynamics and physics. When the interaction is constrained, the model produces LCC cloud decks that are shifted toward the coast, closer to where they should be.
The slight change in dynamics that occurs because of the nudging (Figs. 3a–3d) produces dramatic changes to the clouds, but those changes do not necessarily represent an improvement of the simulated cloud decks. The bottom row of Figure 3 shows that the biases in the sensitivity run from GOCCP are not small. The offshore reductions of LCC result in very large negative LCC biases in June, July and August (JJA). Since dynamics is prescribed in the sensitivity test, the poorer performance of the cloud decks in that run (bottom row; Figs. 3g and 3h) is primarily due to errors in the model physics.

Figure 3. (Top row) Mean annual cycle in lower tropospheric stability (LTS) and (second row) in 700‐hPa vertical velocity in (a and c) the Northeast Pacific (NEP) and (b and d) the Southeast Pacific (SEP). (Third row) June–August seasonal mean low cloud cover differences (percent cloud fraction) in (e) NEP and (f) SEP between the sensitivity run and the Atmospheric Model Intercomparison Project (AMIP) ensemble in E3SMv1 with sensitivity differences due to model physics-dynamics interactions. (Bottom row) Biases in the sensitivity run from GCM‐Oriented CALIPSO Cloud Product (GOCCP) in the same two regions with differences due to model physics only.
Conclusions
This study finds that the persistent problem with simulating marine low stratiform cloud decks has multiple causes. The nudging technique provides a useful way to quantify the LCC biases (including centroid distances, area ratios, and overlap ratios) associated with the model physics. However, since large LCC differences are found between the free-running and nudged simulations, the LCC biases are primarily attributed to feedbacks between the model dynamics and physics. These results suggest that both the widely recognized model deficiency in physical process representations (model physics) and the less-recognized physics-dynamics interactions are important in simulating these low-level cloud decks.
Publication
- Brunke, M. A., Ma, P.‐L., Reeves Eyre, J. E. J., Rasch, P. J., Sorooshian, A., & Zeng, X. (2019). Subtropical marine low stratiform cloud deck spatial errors in the E3SMv1 Atmosphere Model. Geophysical Research Letters, 46, 12598-12607. https://doi.org/10.1029/2019GL084747
Contact
- Michael Brunke, University of Arizona